Make SPC alerts lead to a documented production decision
For production managers, planners and plant leaders · Compare approaches
TL;DR — what you’ll learn
- Displaying red out-of-control points on a shop-floor SPC monitor without an owned reaction workflow either trains operators to click past alerts while parts remain inside drawing tolerance or triggers unrecorded knob-turning (over-adjustment).
- Bind every control-chart rule breach to the characteristic's approved Out-of-Control Action Plan (OCAP), separating measurement/gauge verification from machine parameter adjustment and suspect-lot containment.
- Bound the suspect production window (pieces produced between the last in-control subgroup and the confirmed alert) so quality evaluates actual exposure before parts advance to the next operation.
- In an illustrative CNC grinding subgroup series (SPC-GRD-2026-19, n = 5 parts sampled every 30 minutes at 120 parts/hour), acting immediately on a Subgroup 6 mean breach at 10:30 (25.0116 mm vs illustrative approved upper control limit UCL_Xbar = 25.0080 mm, while observed individual parts up to 25.0130 mm remain 0.0070 mm below the 25.0200 mm drawing upper specification limit) isolates the 60 interval pieces in Tote T-06, verifies a coolant-nozzle clog, applies an engineering-approved -0.0090 mm dressing offset, and restores statistical control on verification subgroup SG-06V (25.0026 mm) rather than treating remaining drawing margin as safe runtime.

Illustrative manufacturing inspection room and machine shop floor; not a client facility.
Many factories invest in shop-floor Statistical Process Control (SPC) displays that plot subgroup means (X-bar) and ranges (R) in real time, yet still suffer batch rejections. When auditors inspect the chart history after a customer complaint, they routinely find dozens of red out-of-control points that occurred hours before the specification breach—with zero record of who acknowledged the signal, whether the gauge was checked, whether the machine was adjusted, or what happened to the parts produced between subgroups. An SPC dashboard becomes an operational control tool only when every approved chart rule triggers an owned reaction workflow linked to the control plan.
Why passive SPC dashboards fail on the factory floor
In automotive and precision industrial quality frameworks—such as the AIAG Quality Core Tools linking Statistical Process Control (SPC), Measurement Systems Analysis (MSA), and the Control Plan, alongside structured inspection records in ERPNext Quality Inspection—a control chart does not evaluate whether an individual piece meets drawing specification (LSL / USL). Instead, control limits (LCL / UCL) detect when a special cause of variation has entered the process so the team can intervene before nonconforming parts are made.
Three operational breakdowns occur when a dashboard plots points without a governed response workflow:
- "It is still inside drawing tolerance, so keep running": Because control limits for subgroup means (
X-bar) sit narrower than individual drawing specification limits (LSL / USL), a subgroup mean can breachUCL_Xbarwhile all5measured pieces are still within drawing limits. Without a mandatory reaction gate, operators ignore the special-cause signal until tool wear or thermal drift pushes the process acrossUSL. - Unrecorded measurement errors trigger process tampering: A single mistyped manual entry (
25.102 mminstead of25.002 mm), a metal chip on a fixture pad, or an unzeroed air gauge produces an immediate out-of-control spike. If an operator dials in a CNC tool-wear offset without first verifying the gauge and re-measuring the sample piece, they inject a real offset error into a stable process. - Unbounded suspect WIP moves downstream during investigation: If subgroups are sampled every
30 minuteson a machine producing120 parts/hour(60 partsper interval) and Subgroup 6 signals a process shift, up to60 partsproduced since Subgroup 5 may have experienced that shift. If those60 partsare dumped into a500-piecedownstream tote before the alert is closed, containment expands from60 piecesto500 pieces.
Four-stage SPC alert-to-decision workflow (OCAP)
This article defines the record, escalation, and containment workflow for SPC alerts; actual control limits, sampling frequencies, and machine adjustments must come from the site's engineering-approved Control Plan and qualified process engineers. Every SPC rule breach should advance through four mandatory states:
Stage 1: Alert generation and suspect-interval tagging
When subgroup k breaches an approved chart rule (for example, Rule 1: 1 subgroup mean outside UCL_Xbar or LCL_Xbar, or 1 subgroup range above UCL_R), the system creates an owned event (SPC_Alert_ID), timestamps the breach, and tags the production interval between Subgroup k - 1 and Subgroup k as Suspect_Interval_Pending_Review.
Stage 2: Measurement and data-entry verification (First Gate)
Before touching any machine offset, the operator or quality technician executes the first step of the approved Out-of-Control Action Plan (OCAP):
- Check gauge zero against the master setting ring/block.
- Clean part and fixture contact surfaces and re-measure the exact
nsubgroup parts. - If the spike was a confirmed typo or foreign particle on the probe, record an attributable measurement correction (retaining the original raw reading and reason code in the audit trail). If the re-measurement confirms the reading, escalate to Stage 3.
Stage 3: Special-cause investigation and engineering-approved adjustment
The operator or process engineer checks the characteristic's predefined special-cause checklist (such as insert wear, grinding wheel glazing, coolant flow/temperature, or material hardness batch change), executes the approved corrective adjustment, and records a verification subgroup (Subgroup k-V) to confirm the process mean and range have returned inside control limits.
Stage 4: Suspect-interval containment and disposition
If any individual reading breached LSL / USL—or if the approved Control Plan requires full screening whenever UCL_Xbar is breached—the 60 parts produced between Subgroup k - 1 and Subgroup k are segregated and inspected before the alert can close.
Route SPC rule breaches through measurement check, process action, and WIP containment
Follow the workflow below, or open its complete text version.
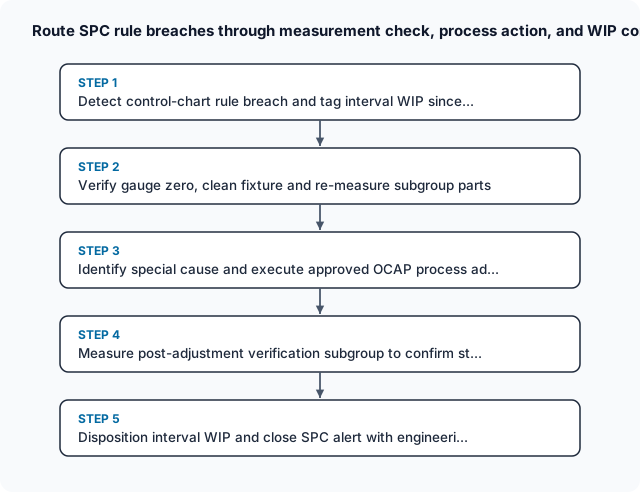
Read the complete workflow as text
- Detect control-chart rule breach and tag interval WIP since... → Verify gauge zero, clean fixture and re-measure subgroup parts
- Verify gauge zero, clean fixture and re-measure subgroup parts → Identify special cause and execute approved OCAP process ad...
- Identify special cause and execute approved OCAP process ad... → Measure post-adjustment verification subgroup to confirm st...
- Measure post-adjustment verification subgroup to confirm st... → Disposition interval WIP and close SPC alert with engineeri...
Worked example: Bearing journal OD grinding series (SPC-GRD-2026-19)
Consider an illustrative X-bar and R control-chart series (SPC-GRD-2026-19) monitoring the finish-ground outer diameter (OD) of a transmission shaft journal on Cylindrical Grinder GRD-07. All specification limits, control limits, and subgroup measurements below are synthetic illustrative parameters constructed to demonstrate the alert-to-decision workflow; they are not universal statistical constants.
Illustrative approved Control Plan parameters (CP-SHF-402-v5)
- Drawing specification (
Nominal ± Tolerance):25.0000 mm ± 0.0200 mm(LSL = 24.9800 mm,USL = 25.0200 mm). - Subgroup sampling plan:
n = 5 consecutive piecesmeasured every30 minutes(0.50 hours) at a line rate of120 pieces/hour(60 piecesproduced per30-minuteinterval). - Illustrative historical baseline control limits (established from approved capability study):
- Process centre line (
CL_Xbar):25.0000 mm - Subgroup mean limits:
LCL_Xbar = 24.9920 mm,UCL_Xbar = 25.0080 mm - Subgroup range limits:
CL_R = 0.0060 mm,UCL_R = 0.0130 mm
- Process centre line (
Subgroup sequence from 08:00 to 11:00 (Subgroups 1 to 6 + 6-V)
During the morning shift, Subgroups 1 through 4 (08:00 to 09:30, 240 pieces) run in statistical control around 25.0002 mm to 25.0018 mm. At 10:00 (Subgroup 5), a partial blockage in the wheel-dressing coolant nozzle causes rapid thermal expansion and wheel loading:
- Subgroup 5 (
10:00, Pieces241–300): Readings =25.0040, 25.0060, 25.0050, 25.0070, 25.0060 mm.- Subgroup Mean (
X-bar_5):125.0280 ÷ 5 = 25.0056 mm(insideUCL_Xbar = 25.0080 mm, rising trend warning). - Subgroup Range (
R_5):25.0070 − 25.0040 = 0.0030 mm.
- Subgroup Mean (
- Subgroup 6 (
10:30, Pieces301–360): Readings =25.0100, 25.0120, 25.0110, 25.0130, 25.0120 mm.- Subgroup Mean (
X-bar_6):125.0580 ÷ 5 = 25.0116 mm(BreachesUCL_Xbar = 25.0080 mmby+0.0036 mm; triggersALERT-SPC-604). - Subgroup Range (
R_6):25.0130 − 25.0100 = 0.0030 mm(insideUCL_R = 0.0130 mm). - Maximum individual piece in Subgroup 6 (
25.0130 mm): still0.0070 mmbelow the drawingUSL(25.0200 mm).
- Subgroup Mean (
The table below traces the complete subgroup series, alert investigation, and verification subgroup (6-V):
Scroll horizontally to see all columns.
| Subgroup ID & timestamp | Interval pieces (60 pcs / 30 min) |
5 sample readings (mm) |
Subgroup mean X-bar (mm) |
Subgroup range R (mm) |
Status vs UCL_Xbar (25.0080 mm) & USL (25.0200 mm) |
Recorded OCAP action and WIP disposition |
|---|---|---|---|---|---|---|
SG-01 (08:00) |
Pcs 1–60 |
24.9990, 25.0010, 25.0000, 25.0020, 24.9990 |
25.0002 | 0.0030 | In control (+0.0002 vs CL) |
Routine release of Tote T-01 (60 pcs) |
SG-02 (08:30) |
Pcs 61–120 |
24.9980, 25.0020, 25.0010, 25.0000, 25.0030 |
25.0008 | 0.0050 | In control (+0.0008 vs CL) |
Routine release of Tote T-02 (60 pcs) |
SG-03 (09:00) |
Pcs 121–180 |
25.0000, 25.0010, 24.9990, 25.0030, 25.0020 |
25.0010 | 0.0040 | In control (+0.0010 vs CL) |
Routine release of Tote T-03 (60 pcs) |
SG-04 (09:30) |
Pcs 181–240 |
25.0010, 25.0020, 25.0000, 25.0040, 25.0020 |
25.0018 | 0.0040 | In control (+0.0018 vs CL) |
Routine release of Tote T-04 (60 pcs) |
SG-05 (10:00) |
Pcs 241–300 |
25.0040, 25.0060, 25.0050, 25.0070, 25.0060 |
25.0056 | 0.0030 | In control (-0.0024 below UCL_Xbar) |
Advisory upward shift noted; Tote T-05 (60 pcs) released |
SG-06 (10:30) |
Pcs 301–360 |
25.0100, 25.0120, 25.0110, 25.0130, 25.0120 |
25.0116 | 0.0030 | OUT OF CONTROL (+0.0036 > UCL_Xbar; all below USL) |
ALERT-SPC-604 opened; Tote T-06 (60 pcs) held; nozzle cleared, wheel dressed, -0.0090 mm offset applied |
SG-06V (10:42 Verify) |
Setup verify (5 pcs) |
25.0010, 25.0030, 25.0020, 25.0040, 25.0030 |
25.0026 | 0.0030 | Restored to control (-0.0054 below UCL_Xbar) |
Tote T-06 (60 pcs) screened (max 25.0140 mm ≤ 25.0200 mm USL), all 60 pcs released; alert closed |
Arithmetic verification of the intervention impact
- Observed mean shift before intervention (
09:30to10:30): BetweenSG-04(09:30,X-bar = 25.0018 mm) andSG-06(10:30,X-bar = 25.0116 mm), the subgroup mean shifted upward by25.0116 − 25.0018 = +0.0098 mmover1.0 hour(+0.0038 mmfrom09:30to10:00and+0.0060 mmfrom10:00to10:30), while within-subgroup range stayed tight at0.0030 mm(±0.0015 mmaround the subgroup mean). - Control-limit breach vs specification margin (
no safe remaining runtime after SPC alert): At10:30(SG-06), the subgroup mean (25.0116 mm) exceededUCL_Xbar(25.0080 mm) by+0.0036 mm, while the highest observed individual reading (25.0130 mm) remained25.0200 − 25.0130 = 0.0070 mmbelow the drawingUSL(25.0200 mm). In a purely illustrative ratio against the two-point average shift (+0.0098 mm/hour),0.0070 mm ÷ 0.0098 mm/hour = 0.714 hours(42.9 minutes, or42 minutes 54 secondsafter10:30, which is11:12:54—after the next scheduled30-minutesubgroup at11:00and before11:15, whereas at the accelerating10:00–10:30step of+0.0060 mm / 30 min = +0.0120 mm/hour,0.0070 ÷ 0.0120 = 0.583 hoursor35.0 minutes,11:05:00). Because two-point thermal and wheel-loading drift is non-linear and unvalidated as a forecast, remaining distance toUSLnever implies safe remaining runtime or justifies continuing production after anSPCalert; immediateOCAPstop/investigation and containment of ToteT-06(60 pieces) are mandatory at10:30. - Containment and adjustment verification:
- Because each
30-minuteinterval (60 pieces) is staged in a dedicated interval tote (T-06) until the next subgroup passes, containment was bounded to exactly60 pieces(Pieces 301–360). - Gauge verification against master setting ring
MSR-25.0000confirmed0.0000 mmgauge drift. Clearing the clogged dressing coolant nozzle, executing a fresh wheel dress, and entering a-0.0090 mmdiameter offset shifted the process mean from25.0116 mmto25.0026 mmon Verification SubgroupSG-06V(25.0116 − 0.0090 = 25.0026 mm). - Screening the
60held shafts in ToteT-06confirmed all60measured between25.0060 mmand25.0140 mm(belowUSL = 25.0200 mm), allowing all365total ground shafts (360interval +5verification) to be released with zero scrap.
- Because each
Roles, reaction boundaries, and exception governance
Scroll horizontally to see all columns.
| Workflow stage | Accountable owner | Required record in SPC system | Exception handling and boundary |
|---|---|---|---|
| Control limit & OCAP configuration | Process engineer & quality engineer | Approved Control_Plan_ID, CL/LCL/UCL parameters, and step-by-step OCAP checklist |
Operators cannot widen control limits or disable chart rules on the terminal |
| Stage 2 measurement verification | Machine operator / QC roving inspector | Master-ring zero check and re-measurement entry on ALERT-SPC-604 |
If a reading was a confirmed typo or dirt spike, the correction requires a reason code and retains the original raw entry |
| Stage 3 process adjustment | Setter / process engineer | Root-cause code (Coolant_Nozzle_Blocked), offset value (-0.0090 mm), and passing SG-06V verification subgroup |
Machine cannot resume standard 30-minute interval mode until verification subgroup SG-06V passes inside LCL/UCL |
| Stage 4 interval WIP disposition | Quality lead | Screening results for held interval tote (T-06, 60 pcs) |
If any piece in T-06 exceeds USL (25.0200 mm), T-06 routes to NCR and backward screening extends to T-05 |
Acceptance tests for SPC alert-to-decision workflows
Scroll horizontally to see all columns.
| Test ID | Scenario seeded in test environment | Expected system behavior | Pass/fail verification evidence |
|---|---|---|---|
ACT-M038-01 |
Enter Subgroup 6 (25.0100, 25.0120, 25.0110, 25.0130, 25.0120 mm, X-bar = 25.0116 mm > UCL_Xbar 25.0080 mm) |
System creates ALERT-SPC-604, places Interval Tote T-06 (60 pcs) on SPC_Hold, and opens the OCAP checklist |
Alert cannot be dismissed with a single click; T-06 transfer to heat-treat is blocked |
ACT-M038-02 |
Operator attempts to log a -0.0090 mm CNC offset on ALERT-SPC-604 before completing Stage 2 gauge/master verification |
System blocks Stage 3 adjustment entry until Stage 2 master-ring check is recorded | Prevents blind machine adjustment on unverified measurement spikes |
ACT-M038-03 |
Seed a typo (25.1020 mm instead of 25.0020 mm) and execute Stage 2 re-measurement correction |
System updates active subgroup mean to 25.0020 mm while preserving original 25.1020 mm raw entry, timestamp, user ID, and reason code |
Full audit trail of measurement correction preserved |
ACT-M038-04 |
Attempt to close ALERT-SPC-604 after logging nozzle cleaning and -0.0090 mm offset without entering Verification Subgroup SG-06V |
System holds alert in Pending_Verification_Subgroup |
Alert closes only after SG-06V (X-bar = 25.0026 mm, R = 0.0030 mm) passes inside control limits |
ACT-M038-05 |
Attempt to release Tote T-06 (60 pcs) before recording interval screening confirmation on ALERT-SPC-604 |
System blocks tote release until quality confirms all 60 interval pieces meet LSL/USL (24.9800–25.0200 mm) |
Tote T-06 released only after documented disposition |
Summary and next actions
SPC charts prevent defects only when an out-of-control signal forces a structured sequence: hold the interval WIP since the last good subgroup, verify the measurement system first, execute the approved reaction plan, and verify stability with a post-adjustment subgroup. Connecting each chart rule to those four records turns passive shop-floor monitors into auditable process controls.
- Link every active SPC chart characteristic to an engineering-approved Out-of-Control Action Plan (
OCAP) that requires gauge and master verification before any machine offset is changed. - Stage parts produced between consecutive subgroups in identifiable interval totes or buffer lots so an out-of-control signal bounds suspect WIP to a single sampling interval.
- Configure the SPC workflow to require a passing post-adjustment verification subgroup (
SG-kV) and documented interval-WIP disposition before an out-of-control alert can close. - Preserve all original raw readings, gauge checks, and reason codes whenever a measurement error is corrected so audit trails remain intact.
Compare this workflow with your current setup
Share the step that takes the most manual work, the systems involved and the exceptions your team handles. That gives us a concrete starting point for comparing approaches.
Sources and further reading
Sources checked 15 October 2026. Worked examples and workflow diagrams are original illustrations, not reported client results.


