Measure continuous-production interruptions without losing buffer movements
For production managers, planners and plant leaders · Compare approaches
TL;DR — what you’ll learn
- Comparing an upstream continuous unit's shift output directly against a downstream packaging or finishing line ignores intermediate surge silos, accumulators, and transit lag, making routine buffer build-ups look like material loss or phantom output.
- Reconcile coupled continuous stages over a synchronized shift cutoff window using the conservation equation: Upstream_Out − Downstream_In = Buffer_Closing − Buffer_Opening + Measured_Line_Rejects + Unresolved_Variance.
- Separate micro-stops absorbed by the surge buffer from true system-starved or system-blocked downtime so OEE and throughput-loss analysis target the actual constraining unit.
- In an illustrative 8-hour continuous polymer-compounding and bagging shift (SHIFT-CMP-2026-A), reconciling 120.0 tonnes extruded upstream against 110.0 tonnes bagged downstream with a +9.4 tonnes surge-silo build and 0.6 tonnes of weighed start-up purge closes the shift balance with 0.0 tonnes unexplained variance and proves that a 35-minute bagger stop cost 0.0 tonnes of extruder throughput.

Illustrative manufacturing inspection room and machine shop floor; not a client facility.
In continuous and semi-continuous manufacturing—such as polymer compounding, cement grinding, paper finishing, wire drawing, and mineral processing—upstream thermal or chemical units cannot stop and restart every time a downstream bagger, palletiser, or slitter pauses for a film roll change. Plants install intermediate surge silos, festoon accumulators, or live-bottom hoppers specifically to decouple those micro-stops. However, when shift production reports read upstream belt scales and downstream pallet counters without capturing opening and closing buffer inventory at the exact same timestamp, management sees conflicting output numbers and misdiagnoses which machine actually constrained shift throughput.
Why decoupled continuous stages disagree at shift handover
When an upstream continuous process (Stage 1) feeds an intermediate surge vessel (Buffer B) that supplies a higher-sprint-speed downstream finishing line (Stage 2), three reporting distortions occur if each stage is evaluated in isolation:
- Buffer accumulation looks like downstream material loss: If the extruder produces
120.0 tonnesduring Shift A while the downstream bagging line pauses for35 minutesto replace a heat-seal bar and packs110.0 tonnes, a naive shift report flags a10.0-tonne(8.33%) discrepancy between extruded and packed output—even though9.4 tonnesis sitting safely inside Surge SiloSILO-02waiting for Shift B to pack at catch-up speed. - Buffer drawdown makes downstream output exceed upstream production: On Shift B, when the bagging line runs at its
16.5 tonnes/hoursprint rating to empty the silo while the extruder holds steady at15.0 tonnes/hour, the bagger packs129.0 tonnesagainst120.0 tonnesextruded—creating the illusion of107.50%material yield. - Absorbed downstream stops are double-counted as plant throughput loss: In OEE and stop-reason frameworks such as OEE.com's availability and performance definitions and Infor MES stop reason taxonomies, a stop on a decoupled downstream unit reduces total plant output only after the intermediate buffer reaches its high-level interlock and forces the upstream bottleneck to throttle back or stop (
Blocked_By_Downstream). Treating every buffer-absorbed bagger pause as lost plant tonnage exaggerates downtime loss and triggers unnecessary capital requests.
Furthermore, when meter readings and level transmitters cross OT/IT network boundaries—a separation emphasized in NIST SP 800-82 Rev. 3 OT security guidance—historian communication dropouts or unsynchronized PLC clocks can cause a stale level reading to be mistaken for zero flow.
Time-aligned conservation equation and stop-state classification
To reconcile adjacent continuous stages over any shift window [t_0, t_1], the production reporting system must capture synchronized boundary readings and classify stops by buffer state:
1. Synchronized stage-to-buffer mass balance
Across the exact time window [t_0, t_1]:
M_up:Cumulative mass (tonnes) discharged from Upstream Stage 1 (corrected for weighed upstream start-up purgeM_purge_up).B_openandB_close:Verified mass (tonnes) in Intermediate Buffer B att_0andt_1from calibrated load cells or radar level-to-volume curves.M_down_goodandM_down_scrap:Good packaged mass (tonnes) and weighed packaging reject/spill mass (tonnes) recorded at Downstream Stage 2.- Conservation check:
M_up_net = (B_close − B_open) + M_down_good + M_down_scrap + M_unresolved.
2. Buffer-aware stop classification
Every stop event on Stage 1 or Stage 2 is tagged with the concurrent buffer state:
- Buffer-absorbed downstream stop (
Stop_Absorbed): Stage 2 stops forΔt,B_closerises, butBremains below its high-level trip (B_max) and Stage 1 continues atfulltarget rate (0.0 tonnessystem throughput loss, recoverable via Stage 2 catch-up capacity). - Buffer-exhausted upstream block (
Stop_Blocked): Stage 2 remains down afterBreachesB_max, forcing Stage 1 to stop or derate; lost Stage 1 tonnage during the blocked interval is attributed to Stage 2's root cause. - Buffer-starved downstream stop (
Stop_Starved): Stage 1 stops andBdrains toB_min, forcing Stage 2 to wait for material.
Reconcile continuous stage counters with synchronized buffer levels
Follow the workflow below, or open its complete text version.
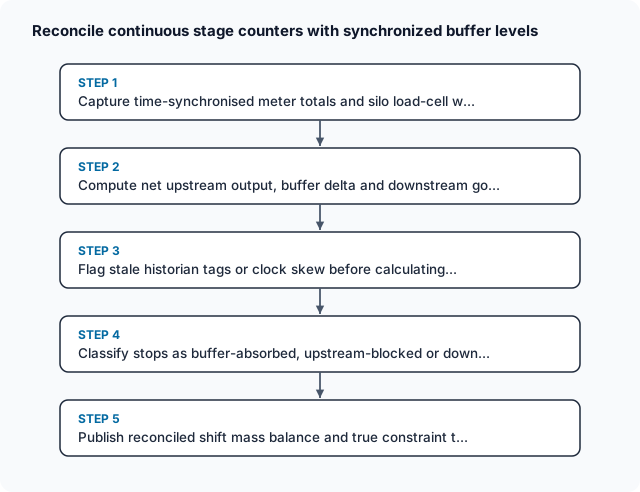
Read the complete workflow as text
- Capture time-synchronised meter totals and silo load-cell w... → Compute net upstream output, buffer delta and downstream go...
- Compute net upstream output, buffer delta and downstream go... → Flag stale historian tags or clock skew before calculating...
- Flag stale historian tags or clock skew before calculating... → Classify stops as buffer-absorbed, upstream-blocked or down...
- Classify stops as buffer-absorbed, upstream-blocked or down... → Publish reconciled shift mass balance and true constraint t...
Worked example: 8-hour compounding extruder and bagging line (SHIFT-CMP-2026-A)
Consider an illustrative 8-hour shift (06:00:00 to 14:00:00, 480 minutes) on a continuous polyolefin compounding line (Line CMP-04) where Twin-Screw Extruder EXT-04 (bottleneck rated at 15.10 tonnes/hour) feeds a 25.0-tonne load-cell-weighed homogenising surge silo (SILO-02), which in turn feeds Automated FFS Bagger BAG-04 (sprint-rated at 17.50 tonnes/hour). All quantities and stop durations below are synthetic operational figures constructed to demonstrate buffer-aligned reconciliation.
Shift operating events (06:00 to 14:00)
- Upstream Extruder
EXT-04(480 minutesscheduled):- Runs
477 minutes(7.95 hours), pausing3 minutesat06:15for a screen-changer pressure spike and discharging0.60 tonnesof transition purge into weighed purge binPB-12. - Gross screw-feeder totaliser input:
120.60 tonnes. - Net good pellets pneumatically conveyed into
SILO-02:120.60 − 0.60 = 120.00 tonnes(15.00 tonnes/houraverage across the 8-hour shift).
- Runs
- Intermediate Surge Silo
SILO-02(25.00-tonnehigh-level interlock):- Opening load-cell weight at
06:00:00(B_open):6.20 tonnes. - Peak load-cell weight during the bagger stop at
10:55:00:14.95 tonnes(staying10.05 tonnesbelow the25.00-tonnehigh-level trip, soEXT-04never slowed down). - Closing load-cell weight at
14:00:00(B_close):15.60 tonnes. - Net buffer accumulation (
ΔB = B_close − B_open):15.60 − 6.20 = +9.40 tonnes.
- Opening load-cell weight at
- Downstream Automated Bagger
BAG-04(480 minutesscheduled):- Stops for
35 minutes(10:20to10:55) to replace a torn PTFE heat-seal tape and clear a split bag (0.20 tonnesof spilled pellets swept and weighed into scrap toteST-04). - Runs
445 minutes(7.4167 hours), producing4,392 accepted 25-kg bags = 109.80 tonnesof palletised good output (M_down_good) plus0.20 tonnesof weighed bagger spill/scrap (M_down_scrap), for110.00 tonnestotal drawn fromSILO-02.
- Stops for
The table below reconciles the naive stage-comparison report against the time-aligned buffer mass balance:
Scroll horizontally to see all columns.
Shift reconciliation line (06:00–14:00) |
Naive stage-vs-stage shift report (tonnes) | Buffer-aligned shift ledger (tonnes) | Share of 120.60 t gross feed (%) | Operational interpretation and OEE impact |
|---|---|---|---|---|
Gross feeder input to EXT-04 |
120.60 t | 120.60 t | Full lot (all units) input basis | Verified loss-in-weight feeder totaliser (06:00–14:00) |
Weighed extruder purge (PB-12) |
0.00 t (omitted) | 0.60 t | 0.50% | 3-min screen-changer purge; weighed at 0.60 t |
Net pellets delivered to SILO-02 (M_up_net) |
120.00 t | 120.00 t | 99.50% | Extruder availability 477 ÷ 480 = 99.38% |
Silo opening balance at 06:00:00 (B_open) |
Ignored | 6.20 t | — | Calibrated load-cell snapshot LC-SILO02-0600 |
Silo closing balance at 14:00:00 (B_close) |
Ignored | 15.60 t | — | Calibrated load-cell snapshot LC-SILO02-1400 |
Net silo buffer change (ΔB = B_close − B_open) |
0.00 t (assumed flat) | +9.40 t | 7.79% | Absorbed 35-min bagger stop; recoverable in Shift B |
Downstream good palletised output (M_down_good) |
109.80 t (4,392 bags) |
109.80 t | 91.04% | Checkweigher-verified 25.0 kg bags (109.80 t) |
Downstream weighed packaging scrap (M_down_scrap) |
Bundled in 10.20 t gap |
0.20 t | 0.17% | Split-bag floor sweepings weighed in tote ST-04 |
Total downstream withdrawal (M_down_good + M_down_scrap) |
109.80 t | 110.00 t | 91.21% | 109.80 t good + 0.20 t scrap = 110.00 t drawn from silo |
Unresolved shift mass variance (M_unresolved) |
10.20 t false loss | 0.00 t | 0.00% | 120.00 t − (9.40 t + 109.80 t + 0.20 t) = 0.00 t |
Arithmetic verification and catch-up recovery calculation
- Mass conservation across the shift window:
Gross Input (120.60 t) = Extruder Purge (0.60 t) + Silo Buffer Increase (9.40 t) + Good Bagged Output (109.80 t) + Bagger Scrap (0.20 t) = 120.60 t(0.00 tunresolved variance). - Why the 35-minute bagger stop caused zero bottleneck throughput loss:
- During the
35-minute(0.5833-hour) bagger stop,EXT-04continued extruding intoSILO-02, adding8.75 tonnes(15.00 t/h × 35 ÷ 60) while peak silo inventory reached14.95 tonnes—well below the25.00-tonnehigh-level trip. - Because
BAG-04can run at17.50 tonnes/hour(2.50 tonnes/hourfaster thanEXT-04's15.00 tonnes/hoursteady rate), Shift B can draw down the+9.40-tonnebuffer accumulation in9.40 t ÷ 2.50 t/h = 3.76 hours(225.6 minutes) without slowing the extruder. - True irreversible material loss for the shift is strictly
0.60 t (extruder purge) + 0.20 t (bagger spill) = 0.80 tonnes(0.66%of gross feed), not10.20 tonnes.
- During the
Governance, timestamp integrity, and exception handling
Scroll horizontally to see all columns.
| Control boundary | Accountable owner | Required system evidence | Exception rule and boundary |
|---|---|---|---|
| Shift cutoff timestamp alignment | Production reporting owner & OT/MES engineer | NTP-synchronised historian snapshots for feeder totalisers, silo load cells, and pallet counters at exact t_0 and t_1 |
Clock skew exceeding an illustrative configured threshold of 30 seconds flags the shift balance as Time_Skew_Warning |
| Stale or missing sensor handling | Shift supervisor | Historian data-quality tag (Good, Uncertain, Bad/Stale) on SILO-02 load cell and feeder totaliser |
A frozen or disconnected tag must remain flagged Stale_Reading and never default to 0.00 tonnes output or empty silo |
| Purge and spill weighing | Line operators | Weighed purge bin (PB-12) and scrap tote (ST-04) tickets before shift sign-off |
Unweighed purge or floor sweepings keep M_unresolved open rather than auto-adjusting feeder totals |
| Constraint stop attribution | Production manager | Stop event log linking downstream stops to concurrent silo high-level interlock state (B ≥ B_max) |
Only stops that actually block or starve the bottleneck unit count as system throughput loss |
Acceptance tests for continuous buffer and downtime reporting
Scroll horizontally to see all columns.
| Test ID | Scenario seeded in test environment | Expected system behavior | Pass/fail verification evidence |
|---|---|---|---|
ACT-M033-01 |
Run Shift A with 120.00 t net extruded, 109.80 t good bagged, 0.20 t bagger scrap, and silo rising from 6.20 t to 15.60 t |
System calculates ΔB = +9.40 t and closes the stage balance with 0.00 t unresolved variance |
Shift report shows 0.80 t (0.66%) total scrap/purge and +9.40 t buffer build, not 10.20 t loss |
ACT-M033-02 |
Log a 35-minute bagger stop while SILO-02 peaks at 14.95 t (below 25.00 t interlock) |
System classifies the stop as Buffer_Absorbed_Downstream_Stop with 0.00 t bottleneck loss |
Bagger availability reflects the 35-min stop, while system constraint throughput loss remains 0.00 t |
ACT-M033-03 |
Simulate a historian gateway drop on SILO-02 load cell at 13:55 (tag quality = Bad/Stale at 14:00 cutoff) |
System blocks automatic buffer-delta calculation and flags Stale_Buffer_Reading |
Silo closing weight is not defaulted to 0.00 t; shift balance held for manual dip/scale check |
ACT-M033-04 |
Seed a 90-minute bagger outage where SILO-02 hits 25.00 t at minute 42 and trips EXT-04 for 48 minutes |
System splits the event into 42 min buffer-absorbed and 48 min Extruder_Blocked_By_Bagger (12.00 t system loss) |
Bottleneck downtime pareto attributes exactly 48 minutes (12.00 t) of extruder loss to BAG-04 |
ACT-M033-05 |
Run Shift B where BAG-04 packs 129.40 t by drawing SILO-02 down from 15.60 t to 6.20 t (ΔB = -9.40 t) while EXT-04 produces 120.00 t |
System reconciles 120.00 t − (-9.40 t) = 129.40 t packed without reporting impossible above-unity extruder yield |
Both individual shift balances and the 16-hour cumulative balance (240.00 t in = 239.20 t good + 0.80 t scrap) close to 0.00 t |
Summary and next actions
Continuous production reports stop generating false variance alarms when every shift balance includes opening and closing buffer inventory alongside upstream and downstream totalisers. Aligning timestamps and separating buffer-absorbed stops from bottleneck-blocking stops lets operations focus on real constraints and real material losses.
- Add opening and closing intermediate silo, hopper, or accumulator weights to every shift production report so upstream and downstream counters are reconciled through the buffer conservation equation.
- Synchronize PLC and historian cutoff timestamps across coupled continuous stages and configure stale or disconnected sensor tags to hold the balance open rather than defaulting to zero.
- Require operators to weigh start-up purge bins and packaging floor spills separately before shift sign-off so real process waste is never confused with buffer inventory changes.
- Tag downstream stop events with the concurrent buffer high-level state so OEE reporting distinguishes absorbed downstream pauses from stops that actually block the bottleneck unit.
Compare this workflow with your current setup
Share the step that takes the most manual work, the systems involved and the exceptions your team handles. That gives us a concrete starting point for comparing approaches.
Sources and further reading
Sources checked 15 October 2026. Worked examples and workflow diagrams are original illustrations, not reported client results.


