Build a price-and-quantity bridge for production material costs
For finance, costing and accounts teams · Compare approaches
TL;DR — what you’ll learn
- Compare costs for the same stated output and material scope.
- Declare the formula used to divide price and quantity effects.
- Make the two terms reconcile to the total cost difference.
- Treat the bridge as arithmetic, not evidence of who caused the variance.
A production report shows material cost above a baseline. Calling the difference “poor efficiency” skips a basic question: how much comes from the price used in the calculation, and how much comes from the quantity?
A price-and-quantity bridge makes that arithmetic explicit. This article uses a simple illustrative convention. It does not choose accounting policy, posting accounts, standard-cost revisions or acceptable variance thresholds.
Hold the comparison scope steady
Assume 100 finished units in both the baseline and actual views, with the same material and unit of measure. The baseline uses 2 kg per finished unit at ₹50/kg. The actual record shows 220 kg at ₹52/kg.
Scroll horizontally to see all columns.
| Calculation | Result |
|---|---|
| Baseline quantity: 100 × 2 kg | 200 kg |
| Baseline cost: 200 × ₹50 | ₹10,000 |
| Actual cost: 220 × ₹52 | ₹11,440 |
| Total difference: ₹11,440 − ₹10,000 | ₹1,440 |
For this bridge, value the price difference at actual quantity and the quantity difference at baseline price:
- Price term: 220 × (₹52 − ₹50) = ₹440.
- Quantity term: (220 − 200) × ₹50 = ₹1,000.
- Reconciliation: ₹440 + ₹1,000 = ₹1,440.
This convention assigns the combined price-and-quantity interaction to the price term. Another declared convention can divide the terms differently while reconciling to the same total. Compare formula definitions before comparing two systems' labels.
Microsoft documents several production variance categories within its costing model, including quantity, price, substitution and lot size. The two-term bridge above is deliberately simpler and should not be presented as a reproduction of every ERP variance report. Microsoft production-order cost analysis.
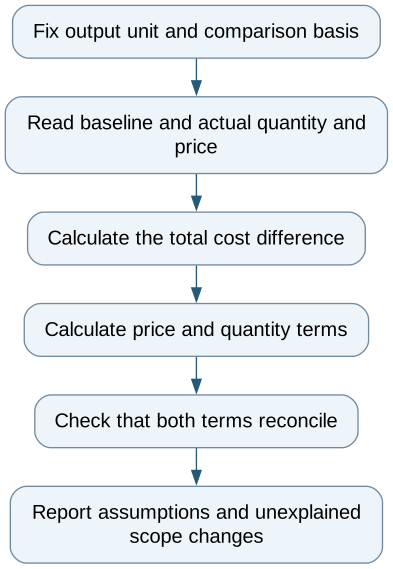
Build a price-and-quantity bridge for production material costs — reporting workflow
Follow the workflow below, or open its complete text version.
Read the complete workflow as text
- Fix output unit and comparison basis → Read baseline and actual quantity and price
- Read baseline and actual quantity and price → Calculate the total cost difference
- Calculate the total cost difference → Calculate price and quantity terms
- Calculate price and quantity terms → Check that both terms reconcile
- Check that both terms reconcile → Report assumptions and unexplained scope changes
Check inputs before explaining causes
If actual output differs from the baseline's 100 units, first establish the intended comparison basis. A quantity difference calculated against the wrong output can be arithmetically correct and commercially misleading. The same applies to mixed units, changed material specifications and included or excluded returns.
Keep source quantity, price, currency and cutoff visible. State whether the price is a single supplied rate or a derived average, and retain enough precision to reconcile before display rounding. Rounding each component early can create a small unexplained residual.
The bridge does not explain why 20 extra kg were recorded. Possible investigations might concern the source records or the production event, but assigning cause requires evidence beyond this calculation. Likewise, ₹440 is a price term under the stated formula, not proof of a purchasing error.
Use boundary cases to test the calculation
When actual price equals baseline price, the price term should be zero. When actual quantity equals baseline quantity, the quantity term should be zero. Test both changes together, a lower actual value and a corrected source quantity. In every case, the terms should sum to actual cost minus baseline cost under the declared formula.
A worksheet can establish this bridge. Use native reports when their definitions fit the review. Automate only after the team can reproduce the terms from the displayed inputs.
The deliverable is an explainable difference with clear assumptions. Decisions about standards, accounts and corrective action remain with their responsible owners.
Compare this workflow with your current setup
Share the step that takes the most manual work, the systems involved and the exceptions your team handles. That gives us a concrete starting point for comparing approaches.
Sources and further reading
Sources checked 15 October 2026. Worked examples and workflow diagrams are original illustrations, not reported client results.