Calculate OEE across products with different ideal cycle times
For production managers, planners and plant leaders · Understand the problem
TL;DR — what you’ll learn
- State the mixed-product aggregation convention before comparing OEE scores.
- Keep counts, cycle times and planned time on one defined resource and reporting basis.
- Distinguish pooled count quality from time-weighted quality; they give different results in this example.
- Preserve first-pass quality, cycle-time versions and corrections so either result can be reproduced.
A machine makes a fast component in the morning and a slower one in the afternoon. One dashboard reports 77.50%; another reports 76.79% from the same shift. The difference can come from how quality is aggregated, rather than an arithmetic error or a change in production.
Overall equipment effectiveness (OEE) needs an explicit calculation contract when product cycle times differ. This guide compares the pooled-factor method documented in OEE.com's mixed-product FAQ with a separately labelled productive-time calculation. Do not present the two as interchangeable versions of one score.
Start from the same production records
This illustrative shift uses one resource with sequential, non-overlapping production. Planned production time is 420 minutes; recorded run time is 380 minutes. The 420 excludes an agreed non-production window but includes changeovers. Each planned minute belongs to the resource once. Counts use a consistent first-pass definition and the applicable approved ideal cycle.
| Product | Total count | First-pass good count | Ideal minutes per piece | Total ideal minutes | Good ideal minutes |
|---|---|---|---|---|---|
| A | 300 | 285 | 0.5 | 150 | 142.5 |
| B | 200 | 180 | 1.0 | 200 | 180.0 |
| Total | 500 | 465 | — | 350 | 322.5 |
The table contains both piece counts and their ideal-time equivalents. Those are different weighting bases. Preserve product-level records instead of storing only the shift totals, because the total good count alone cannot reconstruct good ideal minutes.
Name the method before comparing scores
Scroll horizontally to explore the full diagram, or open the text version below.
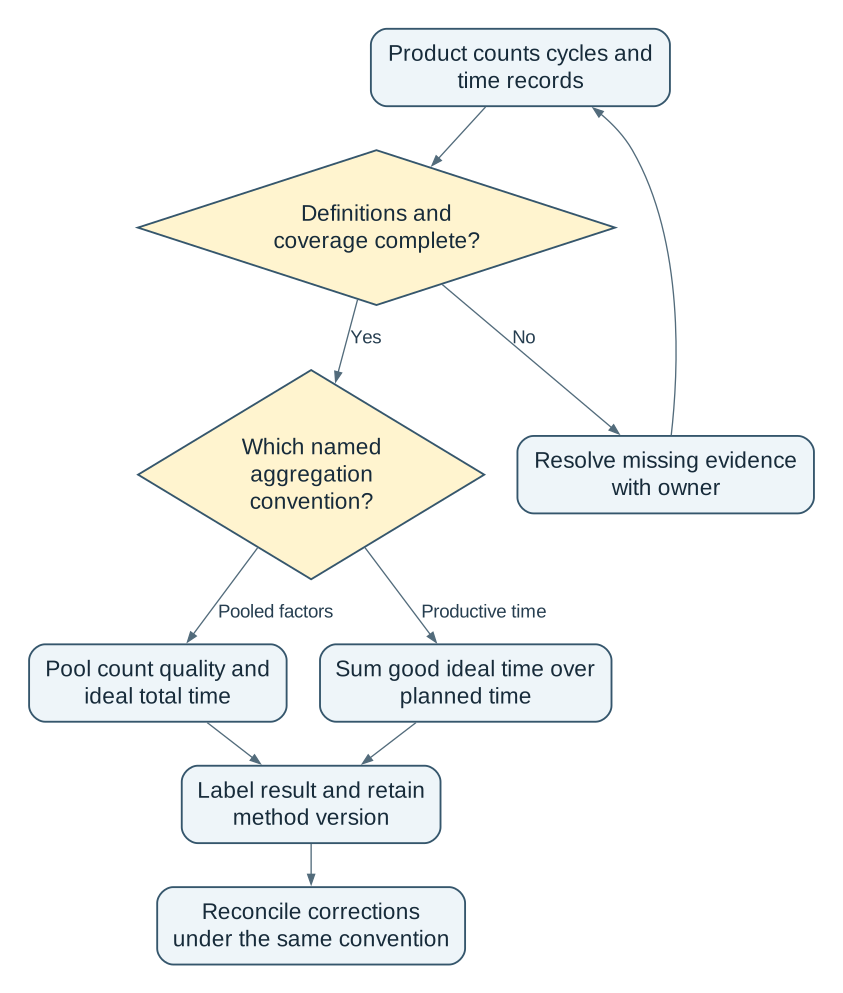
Read the complete workflow as text
- Product counts cycles and time records → Definitions and coverage complete?
- Definitions and coverage complete? → No: Resolve missing evidence with owner
- Resolve missing evidence with owner → Product counts cycles and time records
- Definitions and coverage complete? → Yes: Which named aggregation convention?
- Which named aggregation convention? → Pooled factors: Pool count quality and ideal total time
- Which named aggregation convention? → Productive time: Sum good ideal time over planned time
- Pool count quality and ideal total time → Label result and retain method version
- Sum good ideal time over planned time → Label result and retain method version
- Label result and retain method version → Reconcile corrections under the same convention
Calculate the documented pooled-factor version
OEE.com's FAQ specifies summed run/planned times for availability, summed total ideal time/run time for performance, and pooled good/total counts for quality. OEE mixed-product FAQ.
Applied to the original figures above:
- Availability = 380 / 420 = 90.48%.
- Performance = 350 / 380 = 92.11%.
- Pooled count quality = 465 / 500 = 93.00%.
- OEE under that convention = (380 / 420) × (350 / 380) × (465 / 500) = 77.50%.
Calculate with unrounded factors, then round the result. The pooled result is supported by the cited method; it must not be dismissed as an incorrect shortcut simply because the next calculation differs.
Show the productive-time calculation separately
The same publisher's basic formula expresses OEE as good count × ideal cycle time / planned production time. OEE calculation reference.
An explicit mixed-product extension is to sum each product's good ideal minutes: (285 × 0.5) + (180 × 1.0) = 322.5. The resulting productive-time ratio is 322.5 / 420 = 76.79%. This is an independently derived time-based measure, not a reproduction of the FAQ's pooled-quality formula.
It can be decomposed using the same availability and performance factors plus time-weighted quality, 322.5 / 350 = 92.14%. Multiplying those unrounded factors gives 76.79%. Label this quality factor explicitly; replacing a dashboard's 93% piece yield with it changes the reporting convention.
On this time basis, the lost productive-time equivalent is 97.5 minutes: 40 not running, 30 of running-time performance loss and 27.5 ideal minutes associated with non-good output. This reconciliation does not establish the causes of those losses.
A planned-time-weighted average of product OEEs reproduces this time-based result when the time segments partition the full denominator. For example, allocate 180 for A and 240 for B, including changeovers once. A's result is 142.5 / 180 = 79.17%; B's is 180 / 240 = 75%. Their unrounded planned-time-weighted mean is 76.79%; their unweighted mean is 77.08%. This algebraic equivalence does not reproduce the pooled-factor result for this mix.
Agree the convention and its owners
The production owner defines the resource, planned-time boundary and metric name. Engineering maintains ideal cycles and versions. Quality defines first-pass good output and treatment of rework. The data owner aligns counts, timestamps and job identity.
Use the documented convention required by the organisation's reporting purpose and installed system. If a productive-time measure is also useful, show it alongside OEE with its own definition. A historical trend must identify a method change rather than presenting the resulting percentage movement as improvement.
Do not substitute the latest observed average cycle for an ideal cycle without an approved method. Preserve the version used for each run. Investigate performance above 100%, incompatible units, overlapping intervals and counts that do not reconcile.
Parallel equipment, multi-cavity tools and simultaneous products need their own capacity/count model; the sequential single-resource example does not settle those cases. Missing counts remain incomplete data. Later quality findings need a traceable reporting correction under the chosen convention.
Accept a reproducible report
A controlled spreadsheet can establish the calculation contract. Configure an existing MES/OEE tool if it exposes its formula and source records. Add capture or integration where missing events prevent a reliable calculation. AI may suggest stop categories for review; it cannot decide which reporting convention the business approved.
For acceptance, reproduce both labelled results, correct one good count and change a cycle version prospectively. The report should explain each change, retain the previous basis and compare like conventions. Confirm that rework handling and planned-time allocation follow the agreed definition before setting any operating target.
The useful result is a score whose meaning survives a change in product mix. In this example, 77.50% and 76.79% answer differently weighted questions; naming that difference prevents a false performance claim.
- Record the reporting purpose, resource boundary and aggregation convention.
- Recalculate one mixed shift from product-level records and reconcile the displayed factors.
- Investigate the underlying losses using consistent definitions before expanding capture or comparing trends.
NextEdge Labs can help scope an OEE data review around the calculation and decision you need, starting with a redacted shift table.
Recognise this problem in your operation?
Tell us where the records or handovers break down. We can discuss the process, data and software questions worth examining first.
Sources and further reading
Sources checked 15 October 2026. Worked examples and workflow diagrams are original illustrations, not reported client results.