Decide what to do with obsolete and excess factory inventory
For stores, inventory control and production teams · Compare approaches
TL;DR — what you’ll learn
- Classifying inventory as obsolete solely because it has not moved in 180 days misclassifies long-cycle or seasonal components while missing newly superseded parts that moved last week under a retired Engineering Change Order (ECO).
- Effective E&O review nets on-hand stock against forward 12-month MRP gross requirements and aftermarket service-spares demand before calculating uncovered exposure.
- Before proposing a write-down to finance, cross-functional teams evaluate three recovery pathways: engineering alternate-BOM substitution, supplier RMA return or customer cancellation claims, and aftermarket spares transfer.
- Across a ₹1,60,00,000 quarterly review (EO-REV-2026-Q3 covering 480 SKUs), forward demand netting absorbs ₹50,00,000 (31.25%) and active engineering/commercial recovery salvages ₹45,50,000 (28.44%), leaving ₹64,50,000 in net unrecovered exposure and a ₹47,00,000 provision proposal.

Illustrative factory raw-material stores and receiving counter; not a client facility.
Why backward-looking inventory aging fails manufacturing
Many plants identify Excess and Obsolete (E&O) inventory by running a backward-looking stock aging report: anything with zero issue transactions in the past 90, 180 or 365 days enters a write-down schedule. In discrete and batch manufacturing, backward movement history is an unreliable proxy for economic utility:
- False positives on valid long-cycle stock: Imported supplier Minimum Order Quantities (MOQs) or critical maintenance spares may sit untouched for eight months while remaining committed to next quarter's production schedule.
- False negatives on immediate ECO obsolescence: When engineering releases an immediate-effectivity Engineering Change Order (
ECO) to replace a component, the old revision may have moved yesterday—so a backward aging report marks it0–30 days freshfor the next six months even though its forward production demand is now zero.
Decide what to do with obsolete and excess factory inventory — reporting workflow
Follow the workflow below, or open its complete text version.
Read the complete workflow as text
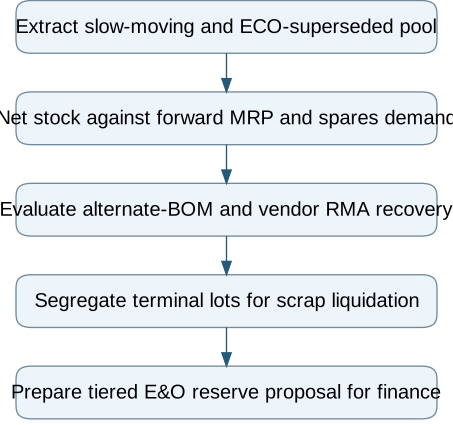
- Extract slow-moving and ECO-superseded pool → Net stock against forward MRP and spares demand
- Net stock against forward MRP and spares demand → Evaluate alternate-BOM and vendor RMA recovery
- Evaluate alternate-BOM and vendor RMA recovery → Segregate terminal lots for scrap liquidation
- Segregate terminal lots for scrap liquidation → Prepare tiered E&O reserve proposal for finance
Four-stage forward-netted E&O governance workflow
To give operations and finance an evidence-based disposition table, quarterly E&O reviews run through four stages:
Stage 01 — Forward MRP netting and horizon partitioning
Instead of looking only backward, the review compares each SKU's unrestricted plus quality-hold balance against forward 12-month gross requirements from the Master Production Schedule (MPS) and aftermarket service forecasts:
- Covered active stock (up to 12 months cover): Retained in active stock.
- Horizon excess (12 to 24 months cover): Active part with valid BOM links, but carrying surplus quantity from forecast drops or high supplier MOQs. Replenishment buying is frozen immediately.
- Zero-demand / superseded stock: No active parent BOM link or zero forward demand across the 12-month horizon.
Stage 02 — Engineering alternate-BOM substitution review
Before purchasing or finance writes down superseded stock, engineering evaluates whether the part can be consumed via an approved deviation or alternate BOM entry on secondary product lines, non-critical sub-assemblies or internal fixture builds.
Stage 03 — Commercial recovery (supplier RMA & customer claims)
For standard catalogue components, purchasing negotiates supplier return-to-vendor (RMA) credits (often subject to a restocking discount) or swaps against open purchase orders. Where excess stock was bought specifically against a customer's binding Make-to-Order commitment or cancelled project, commercial teams prepare a contractual recovery claim.
Stage 04 — Aftermarket spares transfer versus physical scrap liquidation
Components for phased-out machines often retain value for aftermarket service commitments. Valid service quantities transfer to the spares store (WH-SVC-01), while shelf-life-expired chemicals and unrecoverable custom castings are physically rendered unusable and sold as scrap so they cannot re-enter active production bins.
Worked example: quarterly E&O review (EO-REV-2026-Q3)
An illustrative industrial machinery manufacturer conducts its Q3 inventory disposition review (EO-REV-2026-Q3) across 480 flagged SKUs carrying a gross book value of ₹1,60,00,000 (₹1.60 Crore). Rather than applying a flat aging percentage, the cross-functional committee evaluates forward netting and recovery across five disposition cohorts under the company's finance-approved reserve matrix:
Scroll horizontally to see all columns.
| E&O cohort & root cause | SKU count | Gross book value (₹) | Share of pool (%) | Forward MRP / spares absorption (₹) | Active recovery: Alt-BOM / RMA / scrap (₹) | Net unrecovered exposure (₹) | Illustrative policy & reserve proposal (₹) |
|---|---|---|---|---|---|---|---|
COHORT-01 Active horizon excess (12–24M cover from MOQ/forecast drop) |
140 | 52,00,000 | 32.50% | 34,00,000 (12M MRP) | 0 (burn down in M13–M18) | 18,00,000 | 25% reserve on surplus above 12M = 4,50,000 |
COHORT-02 ECO superseded stock (ECO-2026-19 phase-out) |
85 | 36,00,000 | 22.50% | 0 | 21,00,000 (Alt-BOM on economy line) | 15,00,000 | 100% reserve on unabsorbable = 15,00,000 |
COHORT-03 Cancelled customer MTO project (PROJ-CANC-2026) |
65 | 28,00,000 | 17.50% | 0 | 22,00,000 (₹12L RMA + ₹10L claim) | 6,00,000 | 100% reserve on net unrecovered = 6,00,000 |
COHORT-04 Legacy machine spares reclassification (5-yr service fleet) |
110 | 24,00,000 | 15.00% | 16,00,000 (spares forecast) | 0 (held in WH-SVC-01) |
8,00,000 | 50% slow-spares reserve on surplus = 4,00,000 |
COHORT-05 Terminal obsolete & shelf-life expired lots |
80 | 20,00,000 | 12.50% | 0 | 2,50,000 (metal scrap cash) | 17,50,000 | 100% net write-down proposal = 17,50,000 |
Total reconciled E&O review (EO-REV-2026-Q3) |
480 | 1,60,00,000 | 100.00% | 50,00,000 (31.25%) | 45,50,000 (28.44%) | 64,50,000 (40.31%) | 47,00,000 (29.38% of gross) |
Reconciling the recovery and reserve arithmetic
- 100% gross pool conservation:
₹50,00,000 (Forward absorption) + ₹45,50,000 (Active recovery) + ₹64,50,000 (Net unrecovered exposure) = ₹1,60,00,000(31.25% + 28.44% + 40.31% = 100.00%). - Working-capital salvage: Engineering and commercial actions recover ₹45,50,000 in value—comprising ₹21,00,000 consumed via approved alternate BOMs, ₹12,00,000 credited by vendors on RMA returns, ₹10,00,000 recovered from the cancelling MTO customer and ₹2,50,000 realized in certified scrap liquidation.
- Itemized reserve proposal: The ₹47,00,000 reserve proposal (
29.38%of gross book value) is tied cohort-by-cohort to net uncovered exposure (25% × ₹18L = ₹4.5L,100% × ₹15L = ₹15L,100% × ₹6L = ₹6L,50% × ₹8L = ₹4L, and100% × ₹17.5L = ₹17.5L) for finance sign-off.
Implementation checklist for E&O prevention
- Mandatory ECO depletion check: Require an on-hand and open-PO stock depletion plan before switching a non-safety ECO to immediate effectivity.
- Automated MRP buy-block: Freeze new purchase requisitions on any SKU whose net uncovered horizon exceeds
12 months. - Physical quarantine of written-down stock: Move fully provisioned obsolete lots into locked location
WH-OBSOLETE-HOLDso written-down stock cannot be re-issued without finance review.
Compare this workflow with your current setup
Share the step that takes the most manual work, the systems involved and the exceptions your team handles. That gives us a concrete starting point for comparing approaches.
Sources and further reading
Sources checked 15 October 2026. Worked examples and workflow diagrams are original illustrations, not reported client results.
