Compare CAPA observations without overstating improvement
For quality, engineering and records teams · Compare approaches
TL;DR — what you’ll learn
- Show event counts and exposure counts together.
- Compare like definitions before calculating a change in rate.
- Distinguish a descriptive reduction from evidence of effectiveness or causation.
- Leave CAPA acceptance and closure outside the reporting calculation.
A corrective and preventive action, or CAPA, report says defects fell from 12 to three. That sounds encouraging, but the production volume also changed. The first reporting improvement is to show both numerator and denominator, with enough context to understand what each counted.
This article covers descriptive arithmetic and evidence presentation. It does not set an effectiveness threshold, sample size or CAPA closure rule.
Keep the denominator in the sentence
In this original illustration, the same defined defect event was counted under the same recording method:
Scroll horizontally to see all columns.
| Period | Recorded events | Inspected units | Descriptive event rate |
|---|---|---|---|
| Before | 12 | 600 | 2.00% |
| After | 3 | 900 | 0.33% |
The unrounded second rate is 0.3333…%. The observed difference is about 1.67 percentage points. Relative to the first rate, the observed reduction is about 83.33%. These are different descriptions of the same arithmetic; a report should label which one it uses.
They do not establish that the action caused the change or will prevent recurrence. Product mix, inspection coverage and other simultaneous changes can alter the comparison. If a unit can contain multiple counted events, call the measure events per inspected unit; do not silently label it the percentage of defective units.
NIST describes a separate statistical procedure for comparing proportions. This example performs no such significance test and makes no population-level inference. Its calculations are descriptive. NIST difference of proportions reference.
Compare CAPA observations without overstating improvement — reporting workflow
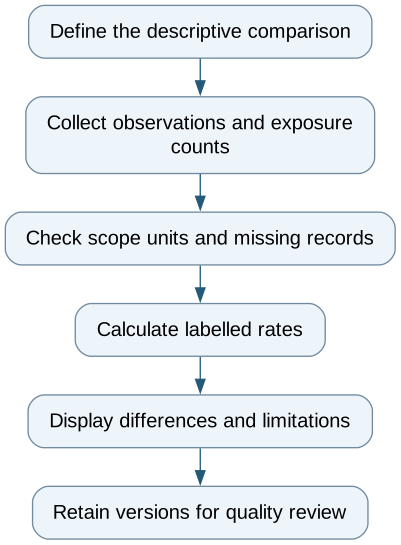
Follow the workflow below, or open its complete text version.
Read the complete workflow as text
- Define the descriptive comparison → Collect observations and exposure counts
- Collect observations and exposure counts → Check scope units and missing records
- Check scope units and missing records → Calculate labelled rates
- Calculate labelled rates → Display differences and limitations
- Display differences and limitations → Retain versions for quality review
Expose comparability before drawing the chart
Alongside each period, show product scope, event definition, inspection method, inclusion rules and source cutoff. If the second period samples only one product family while the first includes three, present that difference before the rates. Do not conceal it in a footnote below a prominent improvement badge.
A period with zero inspected units has no rate under this definition. Display “not calculable: no denominator,” not 0%. Missing inspection records are also different from a measured zero. Keep an explicit missing-data count and explain whether the numerator and denominator cover the same population.
Retain the source IDs used for both counts. Repeated synchronization of the same observation should not add another defect, and a corrected classification should produce a new report version with an explainable difference.
Use the report to support a review
ERPNext's nonconformance record includes corrective and preventive actions. Those fields can hold or link evidence, but a completed action field does not establish effectiveness. ERPNext nonconformance documentation.
A worksheet can calculate the first comparison. A native quality report may already expose the data. Additional automation is useful when it reliably maintains the definitions and retrieves the supporting observations. It should not close CAPAs when a chart crosses a threshold invented by the software team.
Test unequal denominators, a zero denominator, late observations, changed product mix and a duplicate event. The output should retain those distinctions and reproduce the arithmetic from the source rows.
Bring the resulting evidence table to the quality review. Whether the evidence supports effectiveness, additional observation or closure remains a separate quality decision.
Compare this workflow with your current setup
Share the step that takes the most manual work, the systems involved and the exceptions your team handles. That gives us a concrete starting point for comparing approaches.
Sources and further reading
Sources checked 15 October 2026. Worked examples and workflow diagrams are original illustrations, not reported client results.