Inventory Turnover Ratio Formula, Days Inventory Outstanding (DIO) and Echelon Working Capital Optimization in Manufacturing ERP
For stores, inventory control and production teams · Compare approaches
TL;DR — what you’ll learn
- Calculate the aggregate Inventory Turnover Ratio strictly as Annual Cost of Goods Sold (COGS) divided by the 13-Point Monthly Average Inventory Valuation (never Dividing Sales Revenue at retail price by Year-End Spot Inventory, which artificially inflates turns by the gross margin markup and seasonal year-end inventory drawdown).
- Decompose plant-wide inventory velocity into three distinct physical echelon turnover ratios in the ERP: Raw Material (RM) Turns driven by supplier lead times and MOQs, Work-in-Progress (WIP) Turns governed by Little's Law and shop-floor routing cycle time, and Finished Goods (FG) Turns driven by forecast accuracy and safety-stock buffers.
- Translate echelon turns into additive Days Inventory Outstanding (DIO = 365 / Turnover Ratio) and Gross Margin Return on Inventory Investment (GMROII) segmented across an ABC-XYZ Value-by-Volatility Matrix so planners never starve high-margin runners while liquidating slow-moving C-Z dead stock.
- Reconcile nettable versus non-nettable inventory before running working-capital velocity reports: strip out obsolete, expired, customer-owned consignment, and MRB quarantine stock from operational DIO so supply chain planners see true active stock coverage.

Illustrative factory raw-material stores and receiving counter; not a client facility.
The Inventory Turnover Ratio—alongside inventory turnover ratio formula, days inventory outstanding dio, and how to calculate inventory turnover (10,000–10,0000 monthly searches in India with +900% quarterly growth)—measures how many times a manufacturing or distribution enterprise cycles through its average inventory investment over a 365-day fiscal period. Together with Days Sales Outstanding (DSO) and Days Payable Outstanding (DPO), its inverse metric Days Inventory Outstanding (DIO, or Days Sales of Inventory DSI) governs the Cash Conversion Cycle (CCC = DIO + DSO − DPO) under APICS / ASCM SCOR (Supply Chain Operations Reference) Asset Management Metrics.
However, in discrete, process, automotive, and industrial equipment manufacturing, relying on the single corporate balance-sheet Inventory Turnover Ratio reported by generic accounting textbooks causes severe operational blind spots:
- The Revenue-Numerator & Spot-Denominator Distortion: When analysts compute
Inventory Turnover = Annual Sales Revenue / Year-End Inventory, a plant with a40%gross margin overstates its physical stock velocity by1 / (1 − 0.40) = 1.67x, and artificially depressing inventory during the final week of December (31st Marchin India) masks 11 months of bloated mid-year working capital. - Echelon Averaging Blindness (
RM vs. WIP vs. FG): A plant reporting a seemingly healthy 6.0x aggregate inventory turnover (60.8 days DIO) can simultaneously suffer from chronic stockouts on Class A imported electronics (turning 18x = 20 days cover against a 45-day sea-freight lead time) while burying $2.4 million inside stagnant Work-in-Progress (WIP) queues and obsolete Class C-Z spare castings (turning 0.4x = 912 days cover). - Denominator Contamination (
Nettable vs. Non-Nettable Stock): Including un-written-off obsolete tooling, MRB quarantine lots, and in-transit ocean containers inside a single unweighted SKU turn formula misleads MRP planners into slashing reorder points on active items.
The architectural solution is to implement a Multi-Echelon Inventory Turnover, Additive DIO, and ABC-XYZ Working-Capital Control Engine directly inside the ERP (SAP S/4HANA MM/FI-CO, Oracle Fusion Supply Chain, Microsoft Dynamics 365, or ERPNext Stock Valuation & Ageing Ledger). Distinct from M009 (which governs cycle counting accuracy) and M024 (which tracks slow-moving inventory write-off reserve provisions), this pillar guide (M131) establishes the exact GAAP/Ind AS mathematical formulas, 13-point denominator smoothing, RM/WIP/FG echelon decomposition, Little's Law WIP velocity link, and ERP parameter tuning rules.
Scope and multi-echelon valuation boundary
This article defines the financial and operational mathematics, ERP general-ledger-to-subledger mapping, echelon decomposition formulas, and inventory parameter controls required to measure and accelerate manufacturing inventory velocity:
- What this framework governs: Computing corporate and SKU-level Inventory Turnover Ratio, Days Inventory Outstanding (
DIO), Cash Conversion Cycle (CCC), and Gross Margin Return on Inventory Investment (GMROII); decomposing aggregate turns into Raw Materials (RM), Work-in-Progress (WIP), and Finished Goods (FG) echelons; applying the 13-Point Monthly Rolling Average Denominator; and binding ABC-XYZ classification to ERP safety-stock and lot-sizing parameters. - What this framework does not replace: Inventory turnover ratios measure historical and rolling stock velocity—they do not replace forward-looking Material Requirements Planning (
MRP) time-phased netting when demand shifts structurally (for example, launching a new product family or building a deliberate strategic buffer ahead of a supplier factory shutdown).
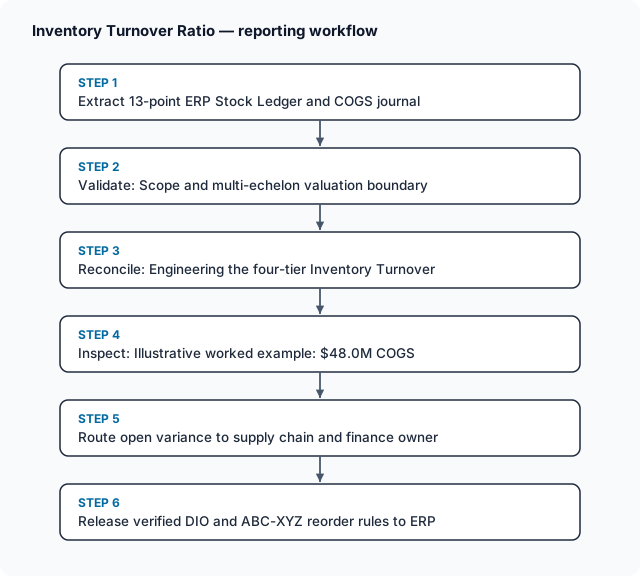
Inventory Turnover Ratio — reporting workflow
Follow the workflow below, or open its complete text version.
Read the complete workflow as text
- Extract 13-point ERP Stock Ledger and COGS journal → Validate: Scope and multi-echelon valuation boundary
- Validate: Scope and multi-echelon valuation boundary → Reconcile: Engineering the four-tier Inventory Turnover
- Reconcile: Engineering the four-tier Inventory Turnover → Inspect: Illustrative worked example: $48.0M COGS
- Inspect: Illustrative worked example: $48.0M COGS → Route open variance to supply chain and finance owner
- Route open variance to supply chain and finance owner → Release verified DIO and ABC-XYZ reorder rules to ERP
Engineering the four-tier Inventory Turnover and DIO mathematical framework
1. The Core Inventory Turnover Ratio, 13-Point Average Inventory, and Days Inventory Outstanding (DIO) Formulas.
To eliminate price-markup distortion and fiscal year-end window dressing, financial controllers and supply chain engineers must align on three foundational equations under Ind AS 2 / IAS 2 (Inventories) and ASCM SCOR:
- Equation 1 — 13-Point Rolling Average Inventory Valuation (
I_avg,13): Instead of averaging only Beginning (Jan 1 / Apr 1) and Ending (Dec 31 / Mar 31) balance sheet snapshots (which ignores 10 intermediate month-end peaks), the ERP computes the arithmetic mean of the opening balance of Month 1 (I_0) plus all 12 month-end closing valuations (I_1 ... I_12) at standard or moving-average cost:
I_avg,13 = (I_0 + I_1 + I_2 + ... + I_12) / 13
- Equation 2 — Aggregate Inventory Turnover Ratio (
ITR_total):
ITR_total = Annual_Cost_of_Goods_Sold_COGS / I_avg,13
(where Annual_COGS equals Direct Material Consumed + Direct Manufacturing Labor + Absorbed Factory Overhead of goods shipped during the 365-day period, excluding SG&A and R&D expenses).
- Equation 3 — Days Inventory Outstanding (
DIO/ Days Sales of InventoryDSI) and Cash Conversion Cycle (CCC):
DIO_total = (I_avg,13 / Annual_COGS) × 365 = 365 / ITR_total
CCC = DIO + DSO − DPO = (365 / ITR_total) + (AR_avg / Annual_Credit_Sales × 365) − (AP_avg / Annual_Purchases_and_COGS × 365)
2. Decomposing Aggregate Turns into Echelon-Specific Velocity (RM, WIP, and FG Turns).
In a manufacturing plant, dividing total COGS (which includes finished assembly labor and packaging overhead) by Raw Material inventory is mathematically mismatched because Raw Materials have not yet absorbed conversion cost! Conversely, evaluating Finished Goods against Raw Material consumption is equally invalid. Therefore, an engineering-grade ERP computes two parallel views of echelon velocity:
Scroll horizontally to see all columns.
| Inventory Echelon | Operational Flow Numerator (Stage-Specific Outflow) |
Stage-Specific Echelon Turnover Formula (True Stage Velocity) |
COGS-Normalized Additive DIO Contribution (Sums to Total Plant DIO) |
Primary Operational Driver & ERP Lever |
|---|---|---|---|---|
1. Raw Materials & Purchased Components (RM) |
Annual Raw Material Issued to Production (C_RM_consumed) |
ITR_RM_stage = C_RM_consumed / I_avg_RM (Stage Hold Days = 365 / ITR_RM_stage) |
DIO_RM_cogs = (I_avg_RM / Annual_COGS) × 365 |
Supplier lead time (L_s), supplier MOQ, safety stock (SS_RM), and vendor consignment (VMI) |
2. Work-in-Progress & Semi-Finished (WIP) |
Annual Cost of Goods Manufactured (COGM transferred to FG) |
ITR_WIP_stage = Annual_COGM / I_avg_WIP (Stage Hold Days = 365 / ITR_WIP_stage) |
DIO_WIP_cogs = (I_avg_WIP / Annual_COGS) × 365 |
Little's Law (WIP = Throughput × Cycle Time): batch transfer size, setup time (SMED), and bottleneck queue wait time |
3. Finished Goods (FG) |
Annual Cost of Goods Sold (Annual_COGS shipped to customers) |
ITR_FG_stage = Annual_COGS / I_avg_FG (Stage Hold Days = 365 / ITR_FG_stage) |
DIO_FG_cogs = (I_avg_FG / Annual_COGS) × 365 |
Demand forecast error (MAPE), distribution warehouse tiers, and make-to-stock (MTS) vs make-to-order (MTO) policy |
| Total Manufacturing Plant | Annual Cost of Goods Sold (Annual_COGS) |
ITR_total = Annual_COGS / (I_avg_RM + I_avg_WIP + I_avg_FG) |
DIO_total = DIO_RM_cogs + DIO_WIP_cogs + DIO_FG_cogs |
End-to-end working capital locked per $1.00 of shipped COGS |
Notice the crucial mathematical distinction between Column 3 (Stage Hold Days) and Column 4 (COGS-Normalized Additive DIO):
- Stage Hold Days (
365 / ITR_stage) tells the Raw Material Planner how many calendar days a purchased steel coil actually sits in the RM warehouse before being issued to a work order (e.g., I_avg_RM / (C_RM_consumed / 365)). - COGS-Normalized DIO (
(I_avg_echelon / Annual_COGS) × 365) weights each echelon by the corporate COGS denominator so thatDIO_RM_cogs + DIO_WIP_cogs + DIO_FG_cogs = DIO_totalidentically on the CFO's Cash Conversion Cycle dashboard.
3. Connecting WIP Turnover to Shop-Floor Physics via Little's Law.
Under Little's Law (L = λ × W), where L is average WIP inventory ($ or units), λ is throughput rate (COGM per day), and W is average manufacturing lead time (Manufacturing Critical-Path Time / MCT in days):
W_WIP_days = I_avg_WIP / (Annual_COGM / 365) = 365 / ITR_WIP_stage
In most batch and discrete factories, actual value-adding machine cutting/assembly time represents ≤ 5% to 10% of W_WIP_days, while 90% to 95% of WIP DIO is queue wait time sitting in front of bottleneck work centers or waiting for batch heat-treatment/QC release. Reducing transfer batch sizes (moving from 500-piece lot transfers to 50-piece single-piece/pallet flow) and cutting setup changeover times (SMED) directly doubles ITR_WIP_stage without risking a single customer stockout.
4. Industry Benchmark Matrix & ABC-XYZ Target Turnover Segmentation.
What is a "good" inventory turnover ratio in manufacturing? Benchmarks vary structurally by production strategy (Make-to-Stock, Assemble-to-Order, Engineer-to-Order) and industry vertical:
Scroll horizontally to see all columns.
| Manufacturing Vertical | Typical Aggregate ITR_total Range |
Typical Total DIO (Days) |
World-Class (Top Quartile) ITR_total |
Structural Working-Capital Bottleneck |
|---|---|---|---|---|
| Automotive OEM & Tier-1 JIT/JIS Stamping/Assembly | 10.0x – 16.0x |
22.8 – 36.5 days |
≥ 18.0x (≤ 20 days) |
Milk-run Sequenced (JIS) vendor buffers & imported electronic semiconductors |
| FMCG, Food & Beverage Processing | 8.0x – 14.0x |
26.0 – 45.6 days |
≥ 16.0x (≤ 23 days) |
Packaging SKU proliferation & seasonal agricultural raw material harvest stock |
| Discrete Industrial Machinery, Pumps & Valves | 4.0x – 7.0x |
52.1 – 91.3 days |
≥ 8.5x (≤ 43 days) |
Long-lead foundry castings/forgings (8–12 wk lead time) & unstandardized sub-assemblies |
| Pharmaceutical Formulations & API Batch Plants | 2.5x – 4.5x |
81.1 – 146.0 days |
≥ 5.5x (≤ 66 days) |
Multi-stage synthesis campaigns, 14-to-21-day QC sterility/stability quarantine holds, & cold-chain safety stock |
Heavy EPC Equipment, Aerospace & Defense (ETO) |
1.8x – 3.5x |
104.3 – 202.8 days |
≥ 4.2x (≤ 87 days) |
Multi-month work-in-progress fabrication cycles & certified exotic alloy plates |
Inside a single plant, applying one flat turnover target across all 5,000 SKUs is counter-productive. Instead, the ERP classifies every active SKU into a 9-box ABC (Annual Consumption Value: A = Top 80%, B = Next 15%, C = Bottom 5%) × XYZ (Coefficient of Variation of Demand CV = σ_d / μ_d: X ≤ 0.50 stable, Y = 0.50–1.00 moderate, Z ≥ 1.00 erratic) matrix:
A-X&A-YHigh-Value Runners (Target Turns: 12x – 24x,DIO: 15 – 30 days): Governed by frequent JIT/Kanban call-offs, tight cycle-count tolerances, and short review intervals (7 days).C-XLow-Value Fasteners/Consumables (Target Turns: 2x – 4x,DIO: 90 – 180 days): Ordered in bulk Economic Order Quantities (EOQ/ Two-Bin VMI) so buyers do not waste$80in administrative PO processing cost to chase$50of M6 bolts.B-Z&C-ZErratic / Spares (Strict Make-to-Order / Max Cap): Defaulted to Make-to-Order (MTO) with zero speculative finished-goods safety stock unless contractually funded by a customer service-level agreement.
Illustrative worked example: $48.0M COGS industrial pump manufacturer (Plant-IN-Pune) — exposing the spot-snapshot trap and unlocking $2.65M in working capital
All figures below are illustrative and synthetic. An industrial centrifugal pump manufacturer (Plant-IN-Pune) reports $80,000,000 ($80.00M) in annual sales revenue and $48,000,000 ($48.00M) in Annual Cost of Goods Sold (COGS, 40.0% Gross Margin) for fiscal year 2026:
- Cost Composition of
$48.00MAnnual COGS (and $48.00M Annual COGM):- Direct Raw Materials & Purchased Castings/Motors Consumed (
C_RM_consumed): $28,800,000 ($28.80M= 60.0% of COGS) - Direct Machining/Assembly Labor & Factory Overhead (
C_conversion): $19,200,000 ($19.20M= 40.0% of COGS)
- Direct Raw Materials & Purchased Castings/Motors Consumed (
- The Misleading Year-End Spot Calculation vs. True 13-Point ERP Ledger Reality:
- On December 31, after a two-week year-end shipping push and a temporary moratorium on supplier receipts, year-end spot inventory drops to $8,000,000.
- A naive report dividing Sales Revenue (
$80.00M) by Year-End Spot Inventory ($8.00M) claims an impressive10.00xturnover (36.5 days DIO). - However, extracting the 13-Point Monthly Average Inventory (
I_avg,13) from the ERP Stock Ledger reveals a completely different operational reality:I_avg,13 = $12,000,000 ($12.00M)—consisting of $5,400,000 in Raw Materials (RM), $3,000,000 in Work-in-Progress (WIP), and $3,600,000 in Finished Goods (FG) (including $950,000 of non-nettable dead/quarantined stock sitting > 365 days without movement!).
Step 1: Compute the true baseline aggregate and echelon turnover ratios.
- True Baseline Aggregate Inventory Turnover (
ITR_total) &DIO_total:ITR_total = $48,000,000 COGS / $12,000,000 I_avg,13 = 4.00x turns/year(less than half of the distorted10.00xclaim!).DIO_total = 365 / 4.00 = 91.25 days(($12.00M / $48.00M) × 365 = 91.25 days).
- True Echelon Stage Hold Days vs. COGS-Normalized Additive DIO:
- Raw Material Echelon (
I_avg_RM = $5.40M,C_RM_consumed = $28.80M/yr = $78,904.11/day):ITR_RM_stage = $28.80M / $5.40M = 5.333x turns/year→ Stage Hold Time =365 / 5.3333 = 68.44 daysin RM warehouse.DIO_RM_cogs = ($5.40M / $48.00M) × 365 = 41.0625 days(COGS-weighted contribution).
- Work-in-Progress Echelon (
I_avg_WIP = $3.00M,Annual_COGM = $48.00M/yr = $131,506.85/day):ITR_WIP_stage = $48.00M / $3.00M = 16.000x turns/year→ Stage Hold Time (Little's Law Lead Time) =365 / 16.00 = 22.8125 dayson shop floor.DIO_WIP_cogs = ($3.00M / $48.00M) × 365 = 22.8125 days.
- Finished Goods Echelon (
I_avg_FG = $3.60M,Annual_COGS = $48.00M/yr = $131,506.85/day):ITR_FG_stage = $48.00M / $3.60M = 13.333x turns/year→ Stage Hold Time =365 / 13.3333 = 27.3750 daysin FG distribution warehouse.DIO_FG_cogs = ($3.60M / $48.00M) × 365 = 27.3750 days.
- Additive DIO Reconciliation:
41.0625 (RM) + 22.8125 (WIP) + 27.3750 (FG) = 91.2500 days = DIO_total!
- Raw Material Echelon (
Step 2: Execute the 3-lever ERP working-capital optimization program.
After auditing the echelon breakdown, the Supply Chain and Operations team executes three targeted ERP interventions over two quarters (while keeping Annual_COGS = $48.00M constant):
- Lever 1 (
RM Echelon: ABC-XYZ Reorder Tuning & Supplier Blanket Call-Offs onA-XCastings): Replaces 60-day batch deliveries on top 40A-Xcast-iron pump casings with weekly Kanban blanket call-offs and liquidates$450,000of obsolete RM, reducingI_avg_RMfrom$5.40Mto$4.20M(-$1.20M). - Lever 2 (
WIP Echelon: Cellular Flow & Transfer Batch Halving): Cuts machining-to-assembly transfer batches from 100 units to 25 units and enforces a 5-day SLA on open MRB quarantine lots, reducingI_avg_WIPfrom$3.00Mto$2.25M(-$0.75M). - Lever 3 (
FG Echelon: SwitchingB-Z / C-ZPump Variants from Make-to-Stock to Assemble-to-Order): Stops pre-assembling slow-moving exotic impeller/seal combinations—stocking modular semi-finished sub-assemblies instead and assemblingB-Z/C-Zorders in 48 hours upon firm customer PO—reducingI_avg_FGfrom$3.60Mto$2.90M(-$0.70M).
Scroll horizontally to see all columns.
Echelon & Working-Capital Metric ($48.00M Annual COGS) |
Distorted Spot/Revenue Claim (Wrong Formula) | True Baseline (13-Pt Avg Before ERP Tuning) | Post-Optimization (After ABC-XYZ & WIP Flow) | Verified Working-Capital & Velocity Gain |
|---|---|---|---|---|
Raw Materials (I_avg_RM & ITR_RM_stage) |
Not separated | $5.40M (5.33x / 68.4 d hold) |
$4.20M (6.86x / 53.2 d hold) |
-$1.20M cash unlocked (-9.125 d COGS DIO) |
Work-in-Progress (I_avg_WIP & ITR_WIP_stage) |
Not separated | $3.00M (16.00x / 22.8 d hold) |
$2.25M (21.33x / 17.1 d hold) |
-$0.75M cash unlocked (-5.703 d COGS DIO) |
Finished Goods (I_avg_FG & ITR_FG_stage) |
Not separated | $3.60M (13.33x / 27.4 d hold) |
$2.90M (16.55x / 22.1 d hold) |
-$0.70M cash unlocked (-5.323 d COGS DIO) |
Total 13-Point Average Inventory (I_avg,13) |
$8.00M (Dec 31 spot) |
$12.00M |
$9.35M |
$2,650,000 ($2.65M) Free Cash Flow Released |
Aggregate Inventory Turnover (ITR_total) |
10.00x (Sales / Spot) |
4.00x ($48M / $12M) |
5.13x ($48M / $9.35M) |
+28.34% True Physical Velocity Increase |
Total Days Inventory Outstanding (DIO_total) |
36.50 days (fictional) |
91.25 days |
71.10 days |
-20.15 days Faster Cash Conversion Cycle |
Annual Inventory Carrying Cost (at 18.0% WACC + Storage) |
— | $2,160,000 / yr |
$1,683,000 / yr |
$477,000 / yr Recurring P&L Carrying Savings |
Independent arithmetic verification.
- Inventory reduction & working capital release check:
- Baseline
I_avg,13=$5.40M + $3.00M + $3.60M = $12.00M. - Post-optimization
I_avg,13=$4.20M + $2.25M + $2.90M = $9.35M. - Released cash =
$12.00M − $9.35M = $2.65M($1.20M RM + $0.75M WIP + $0.70M FG = $2.65M).
- Baseline
- Post-optimization additive DIO identity:
DIO_RM_cogs = ($4.20M / $48.00M) × 365 = 31.9375 days(down from 41.0625 days; delta = −9.1250 days).DIO_WIP_cogs = ($2.25M / $48.00M) × 365 = 17.109375 days(down from 22.8125 days; delta = −5.703125 days).DIO_FG_cogs = ($2.90M / $48.00M) × 365 = 22.052083 days(down from 27.3750 days; delta = −5.322917 days).- Sum of post-optimization echelon DIOs =
31.9375 + 17.109375 + 22.052083 = 71.098958 days = ($9.35M / $48.00M) × 365(ITR_total = 48.00 / 9.35 = 5.13369x;365 / 5.13369 = 71.10 days).
- Carrying cost & GMROII verification:
- At an
18.0%annual inventory carrying cost (11% cost of capital + 4% warehouse space/handling + 3% insurance/obsolescence), unlocking$2.65Msaves$2,650,000 × 0.18 = $477,000/year. - Gross Margin Return on Inventory Investment (
GMROII = Annual_Gross_Margin / I_avg,13) improves from$32.00M / $12.00M = 2.67x (266.7%)to$32.00M / $9.35M = 3.42x (342.2%).
- At an
Workflow, owner roles, exception handling and recovery controls
Scroll horizontally to see all columns.
| Workflow stage | Accountable owner | Required system evidence | Exception condition | System hold & recovery control |
|---|---|---|---|---|
| 1. Monthly 13-Point Subledger-to-GL Extraction | Cost Accountant & ERP Data Lead | Reconciled month-end stock valuation snapshot (I_t) across RM, WIP, and FG GL accounts |
ERP stock subledger total differs from Financial General Ledger Inventory balance due to manual journal entries | Block DIO/Turnover executive publication (ERR_GL_SUBLEDGER_VARIANCE) until unlinked manual GL journals are reversed |
| 2. Nettable vs Non-Nettable Stock Segregation | Warehouse Manager & Quality Lead | Segregated warehouse flags (NETTABLE_ACTIVE, MRB_QUARANTINE, OBSOLETE_RESERVE, CONSIGNMENT_VMI) |
Vendor-owned consignment stock (zero balance-sheet cost) or quarantined MRB lots distort active SKU DIO |
Automated SQL filter computes both Gross Total DIO (for Finance) and Active Nettable DIO (for MRP Planners) |
| 3. Quarterly ABC-XYZ Classification Refresh | Supply Chain Analytics Lead | Rolling 12-month consumption value (ABC) and weekly demand CV = σ/μ (XYZ) per SKU |
A previously high-volume A-X part drops into C-Z erratic demand after a customer model phase-out, keeping high safety stock |
ERP flags ABC_XYZ_DRIFT_ALERT and places a hold on automatic reorder-point (ROP) PO generation until planner review |
| 4. Echelon DIO Breach & Root-Cause Routing | Materials Manager (RM), Plant Manager (WIP), S&OP Lead (FG) |
Echelon DIO vs target band (DIO_RM ≤ 32d, DIO_WIP ≤ 18d, DIO_FG ≤ 22d) |
WIP DIO spikes by ≥ 4.0 days due to stalled work orders waiting on a single bottleneck test bench or open NCR |
Trigger Stalled Work Order Ageing Exception (WIP_AGE ≥ 14 days); cap new Work Order releases until WIP queue clears |
5. Slow-Moving & Obsolete (SLOB) Liquidation Gate |
Commercial & Engineering Change Board | Days_Since_Last_Issue ≥ 180 days and forward 90-day MRP gross requirement = 0 |
Engineering releases a new BOM revision without consuming ordispositioning $85,000 of prior-revision components |
Enforce ECN disposition signoff (Exhaust-Before-Cutover, Rework, Return-to-Vendor, or Write-Off) before BOM activation |
Bounded pilot and implementation check
Pilot the Multi-Echelon Inventory Turnover, 13-Point DIO, and ABC-XYZ ERP parameter optimization workflow across 1 product family (250 to 500 active RM, WIP, and FG SKUs) over 6 weeks:
- Pilot boundary: Replace spot balance-sheet formulas with automated 13-point monthly average queries in the ERP, split velocity reporting into
RM,WIP, andFGechelons, classify all pilot SKUs into the 9-boxABC-XYZmatrix, and convertB-Z / C-Zfinished goods from Make-to-Stock (MTS) to Assemble-to-Order (ATO) or Make-to-Order (MTO). - Acceptance tests:
ACT-M131-01(Additive Echelon DIO Mathematical Identity): Run the ERP executive working-capital report for any 12-month period and verify thatDIO_RM_cogs + DIO_WIP_cogs + DIO_FG_cogsequalsDIO_total(365 / ITR_total) to within±0.01 days.ACT-M131-02(Revenue vs COGS Numerator Guardrail): Attempt to configure a custom inventory turnover widget using gross invoiced sales revenue in the numerator; confirm the BI semantic layer enforcesAnnual_COGSforITRandFGturns andC_RM_consumedforRMstage turns.ACT-M131-03(C-ZSpeculative Safety-Stock Block): Reclassify an erratic SKU (CV = 1.45) into segmentC-Zand attempt to upload a static safety-stock floor equivalent to 60 days of average demand; confirm the ERP policy validator flags anERR_CZ_MTS_POLICY_VIOLATIONrequiring S&OP override.ACT-M131-04(Aged WIP Queue Release Interlock): Simulate a Work Order sitting inWIPwith zero operation job-card transactions for≥ 15 consecutive calendar days; confirm the system surfaces the order on the daily WIP DIO exception board and alerts Production Control.
Next actions
- Standardize on
Annual COGS / 13-Point Monthly Average Inventoryacross Finance and Operations: Eliminate distortedSales / Year-End Spot Inventorycalculations that hide mid-year working-capital bloat and gross-margin price inflation. - Track Raw Material, WIP, and Finished Goods velocity separately: Hold Procurement accountable for
RM Stage Hold Days, Manufacturing Operations accountable forWIP Cycle Time / Little's Law turns, and S&OP/Sales accountable forFG turns. - Bind ERP reorder parameters (
Safety Stock, Lot Size, MTS vs MTO) to a quarterly ABC-XYZ matrix: Compress cycle stock onA-Xrunners via frequent call-offs while removing speculative safety stock fromB-ZandC-Zerratic SKUs. - Separate Active Nettable DIO from Quarantined and Obsolete (
SLOB) stock: Give MRP planners a clean view of usable coverage while forcing a monthly commercial liquidation cadence on non-moving inventory.
Frequently Asked Questions
Why does the aggregate balance-sheet Inventory Turnover Ratio mislead manufacturing plants, and how should finance and supply chain teams decompose turns and Days Inventory Outstanding (DIO) across Raw Materials, WIP, and Finished Goods in ERP?.
Teams should govern inventory turnover ratio measurement by replacing single year-end balance-sheet snapshots with a 13-point monthly rolling average decomposed across Raw Materials, Work-in-Progress, and Finished Goods echelons. Using annual Cost of Goods Sold rather than sales revenue prevents gross-margin markup distortion, while separating RM consumption turns, Little's Law WIP throughput turns, and FG shipment turns reveals whether excess cash is trapped in supplier MOQs, shop-floor queues, or finished safety stock.
How does inventory turnover ratio formula handle exceptions and mismatches?.
When an exception distorts the inventory turnover ratio formula—such as a year-end inventory dip, unlinked manual general-ledger journal entries, or quarantined MRB and obsolete lots sitting inside warehouse balances—the ERP reporting workflow segregates non-nettable stock from active operational inventory. Finance and supply chain owners reconcile subledger-to-GL variances and review ABC-XYZ drift exceptions before updating MRP reorder points or safety-stock buffers.
What should teams test before automating days inventory outstanding dio?.
Before scaling days inventory outstanding dio dashboards and automated ABC-XYZ reorder rules across all plants, run a 6-week pilot on one product family covering 250 to 500 RM, WIP, and FG items. Verify that COGS-normalized echelon DIOs sum exactly to total plant DIO, aged WIP work orders trigger queue-hold alerts, and switching erratic C-Z items from Make-to-Stock to Make-to-Order reduces working capital without lowering customer on-time delivery.
Compare this workflow with your current setup
Share the step that takes the most manual work, the systems involved and the exceptions your team handles. That gives us a concrete starting point for comparing approaches.
Sources and further reading
Sources checked 15 October 2026. Worked examples and workflow diagrams are original illustrations, not reported client results.
- ASCM (APICS) Supply Chain Operations Reference (SCOR) Digital Standard — Asset Management Metrics: Inventory Days of Supply, Cash-to-Cash Cycle Time, and Inventory Turns
- Institute of Chartered Accountants of India (ICAI) — Ind AS 2 (IAS 2): Inventories Valuation, Cost of Conversion, and Net Realizable Value Rules
- MIT Sloan / Operations Research — Little's Law (L = λW) in Manufacturing Work-in-Progress (WIP) and Factory Physics
- ERPNext Stock & Inventory Management: Stock Ledger Valuation, Stock Ageing, and ABC-XYZ Reorder Controls


