Build a supplier scorecard that cannot hide late or rejected deliveries
For procurement, stores and subcontract operations teams · Compare approaches
TL;DR — what you’ll learn
- Measure delivery performance against the last mutually confirmed date outside the freeze window rather than an unacknowledged buyer pull-in.
- Report line-level on-time counts, piece-level accepted quantities and critical lot rejections as separate visible metrics instead of a single blended percentage.
- Treat a critical safety or functional batch rejection as an explicit review trigger even when overall piece acceptance exceeds 90%.
- Show zero-delivery periods as "no activity in period" rather than 100% on-time performance.

Illustrative factory raw-material stores and receiving counter; not a client facility.
In a monthly review, a precision-turning supplier displays a 91% composite scorecard rating (90% on-time delivery against supplier-confirmed dates weighted at 50%, plus 92% piece acceptance weighted at 50%) and remains in the "preferred" tier. During that same month, however, the supplier delivered one lot of 80 high-pressure shafts (PO-224) with an unapproved heat-treatment deviation that failed incoming inspection in full and stopped assembly for three days. Blending nine accepted deliveries with one critical lot failure hid the operational risk behind a comforting average.
This guide covers a drill-down supplier scorecard that separates delivery baseline rules, lot-level quality gates and sample-size indicators. Supplier tier classification, corrective-action mandates and commercial allocation decisions remain with the procurement head and supplier quality engineer.
Keep delivery baselines, piece counts and lot-rejection gates distinct
Consider an original illustrative monthly record for Supplier SUP-14 across 10 receipt lines totaling 1,000 pieces received.
Scroll horizontally to see all columns.
| Receipt category | Receipt lines | Total pieces received | On-time vs confirmed date (lines) | Late due to supplier (lines) | Buyer pull-in inside freeze (lines) | Accepted pieces | Rejected pieces | Lot-level QC result |
|---|---|---|---|---|---|---|---|---|
| Routine spacers & pins (8 lines) | 8 | 820 | 8 | 0 | 0 | 820 | 0 | 8 of 8 lots accepted |
Expedited bracket line (PO-219) |
1 | 100 | 1 (met original confirmed date; missed unconfirmed pull-in) | 0 | 1 | 100 | 0 | 1 of 1 lot accepted |
High-pressure shaft lot (PO-224) |
1 | 80 | 0 | 1 (6 days late) | 0 | 0 | 80 | 1 critical lot rejected in full (NCR-204) |
| Monthly total | 10 | 1,000 | 9 / 10 (90.0% vs confirmed; 8 / 10 or 80.0% vs buyer-requested) | 1 supplier-late line | 1 unacknowledged pull-in | 920 (92.0%) | 80 (8.0%) | 9 lots accepted / 1 critical lot rejected (gate triggered) |
Compare what a blended score hides versus what the separated table exposes:
- Delivery accuracy across both baselines: Against unadjusted buyer-requested dates, the supplier looks 80.0% on time (8 of 10 lines) because
PO-219missed an unconfirmed pull-in andPO-224arrived 6 days late. SeparatingPO-219shows the buyer pulled the requested date inside the frozen window without supplier confirmation while the supplier delivered on the original confirmed date (1in the confirmed-date column)—so supplier-confirmed on-time delivery is 9 of 10 lines (90.0%) (8 + 1 + 0 = 9), with 1 supplier-late line (PO-224). - Quality gate: Piece-level acceptance is 920 of 1,000 pieces (92.0%), and lot acceptance is 9 of 10 lots (90.0%). Because
PO-224failed a critical characteristic in full (80 of 80 pieces rejected underNCR-204), the critical-rejection gate triggers an immediate quality review and holds new awards regardless of the 91.0% simple average of 90.0% confirmed OTD and 92.0% piece acceptance.
Reference material for ERPNext quality inspection and the ISO 9001 catalogue (which lists ISO 9001:2026, sixth edition) provides context for recorded inspection evidence and supplier monitoring; always verify your organisation's specific certification scope and quality manual before claiming clause-level compliance.
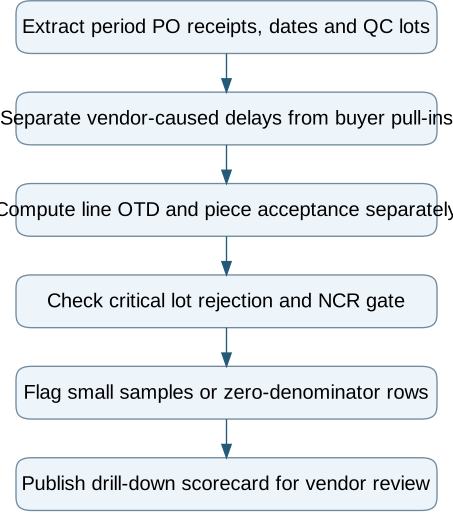
Build a supplier scorecard that cannot hide late or rejected deliveries — reporting workflow
Follow the workflow below, or open its complete text version.
Read the complete workflow as text
- Extract period PO receipts, dates and QC lots → Separate vendor-caused delays from buyer pull-ins
- Separate vendor-caused delays from buyer pull-ins → Compute line OTD and piece acceptance separately
- Compute line OTD and piece acceptance separately → Check critical lot rejection and NCR gate
- Check critical lot rejection and NCR gate → Flag small samples or zero-denominator rows
- Flag small samples or zero-denominator rows → Publish drill-down scorecard for vendor review
Handle small sample sizes and zero-delivery months honestly
If a tooling supplier delivers only one order in a quarter, show 1 / 1 lines on time (low sample: n=1) alongside the raw count rather than ranking them above a 50-line production vendor at 96% (48/50). If a supplier has zero scheduled deliveries in a month, output No scheduled receipts (0/0) instead of defaulting a division-by-zero formula to 100%.
Test the scorecard on three suppliers before publishing rankings
Recompute last month's numbers for three active suppliers using line-level transaction drill-downs. Confirm that every percentage displays its exact numerator and denominator (9/10 lines vs confirmed, 8/10 lines vs requested, 920/1,000 pcs) and that any disputed date or critical NCR links directly to the underlying receipt and inspection record.
Compare this workflow with your current setup
Share the step that takes the most manual work, the systems involved and the exceptions your team handles. That gives us a concrete starting point for comparing approaches.
Sources and further reading
Sources checked 15 October 2026. Worked examples and workflow diagrams are original illustrations, not reported client results.