Calculate food cost percentage from usage, not the week's purchases
For Finance controllers, CFOs and accounts teams · Understand the problem
TL;DR — what you’ll learn
- Calculate food used from opening stock, purchases, relevant transfers and closing stock.
- Divide by food sales for the same period and on an agreed reporting basis.
- Avoid confusing purchase timing with consumption or outlet transfers with external purchases.
- Investigate a percentage change through quantities, prices, mix and data quality.
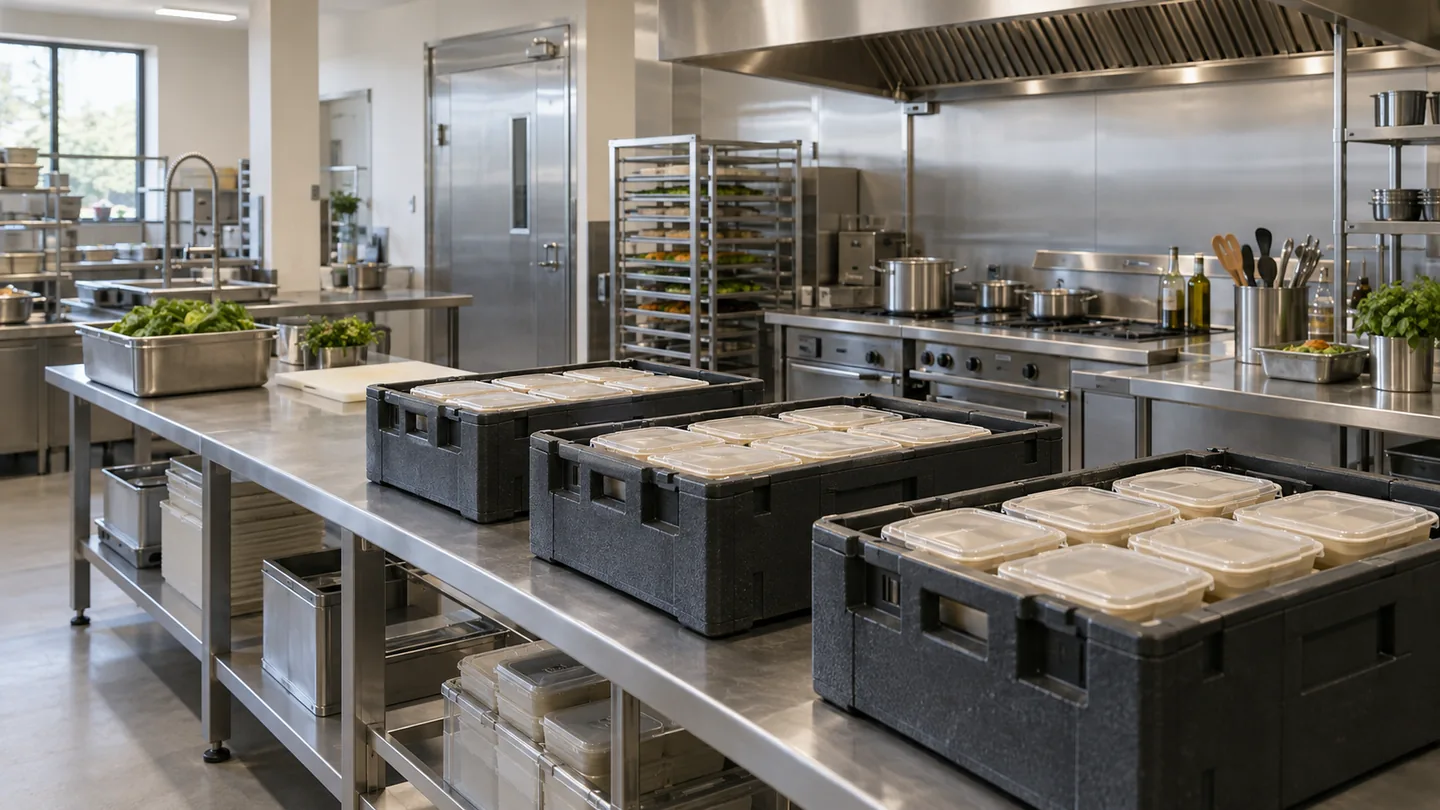
A large delivery lands on Monday. Dividing that week's purchases by sales makes food cost look unusually high, even though much of the delivery remains on the shelf. The following week can look unusually good. Neither percentage describes what the kitchen actually used.
How do you calculate food cost percentage for a restaurant or outlet?
Divide the cost of food used during the period by food sales for the same period, then multiply by 100. For a simple single-location account, food used is opening inventory plus purchases minus closing inventory. Include relevant transfers and agreed adjustments when the operating boundary requires them.
- 01Define the periodStock and revenue scope
- 02Calculate food costOpening plus net receipts minus close
- 03Check the basisTransfers, exclusions and net salesDo the cost and sales scopes match?YesReport the percentageNoReconcile the accounts before comparing outlets or periods.
- 04Report the percentageShow amounts beside the ratio
Illustrative information flow. The article explains the evidence, exceptions and responsible decisions. Diagram: NextEdge Labs.
A worked outlet calculation
Assume these illustrative figures use a consistent valuation basis and the same weekly cutoff. Transfers move stock between outlets and therefore affect this outlet's account.
| Component | Amount |
|---|---|
| Opening food stock | ₹40,000 |
| Purchases received in the period | +₹80,000 |
| Transfers received | +₹10,000 |
| Transfers sent | −₹5,000 |
| Closing food stock | −₹35,000 |
| Food used within this boundary | ₹90,000 |
| Food sales on the agreed basis | ₹300,000 |
| Food cost percentage | ₹90,000 ÷ ₹300,000 × 100 = 30% |
Source: BCcampus Open Education · Basic food-cost and food-cost percentage formulas. Reference details
Decide what the percentage includes
Use food sales if the numerator concerns food; mixing in unrelated beverage or merchandise revenue can distort the result. Agree how returns, complimentary meals, staff meals and taxes are treated. Finance should define the reporting basis so comparisons remain consistent between periods and locations.
At a consolidated business level, internal transfers should not count as additional external purchases. At outlet level they matter. This is why copying a formula from another business without defining the boundary can create a perfectly calculated but unhelpful number.
Why purchases divided by sales gives a different answer
In the worked example, purchases are ₹80,000 and food sales are ₹300,000. Dividing purchases by sales gives about 26.7%, while the reconciled usage account gives 30%. The difference comes from opening and closing stock and net transfers. Neither arithmetic operation is difficult; only one answers the defined question about food used during that week.
A large purchase near the end of a period can push the purchase-based percentage the other way. If the delivery remains in closing stock, treating it all as current consumption exaggerates the period's food use. This is why reliable counts and receipt cutoffs matter even when the sales total comes directly from the POS.
A price change and a usage change need different responses
Suppose the next comparable period uses the same physical quantities but costs more because ingredient prices rose. Portion control would not address that cause. If prices are stable but consumption rises relative to recorded sales and recipe requirements, the investigation moves toward product mix, non-sale uses, yield, recording errors or operational loss.
Separate these explanations before asking an outlet to reduce its percentage. A manager can lower the reported percentage by changing the sales mix or by missing a stock adjustment without improving the underlying operation. Pair the financial ratio with the relevant quantity account and retain the evidence for any correction.
Do not average outlet percentages without their sales weights
Consider an illustrative Outlet A with food used of ₹30,000 and food sales of ₹100,000: 30%. Outlet B uses ₹20,000 against ₹50,000 sales: 40%. Their combined percentage is ₹50,000 divided by ₹150,000, or about 33.3%. A simple average of 30% and 40% gives 35%, which does not represent the combined usage-to-sales ratio.
Use consolidated amounts after applying the agreed treatment of internal transfers. Keep outlet-level detail for diagnosis, since one outlet's improvement can mask another's deterioration. The dashboard should make it clear whether a figure is a weighted business total or a local operating result.
Handle incomplete and zero-sales periods honestly
If a closing count is missing, display the report as incomplete or label the approved estimate. If food sales are zero, the ordinary percentage is undefined; show the underlying usage and the reason instead of a misleading zero. A newly opened outlet or a day of preparation without sales may still have legitimate stock movements.
These conditions belong in the reporting specification before automation begins. Ask the implementation team to demonstrate a missing count, an unconfirmed transfer and a zero-sales period. The report should direct the user to the missing evidence or relevant explanation. It should not make the chart look continuous by quietly filling gaps.
A percentage is an indicator, not a diagnosis
A higher result may reflect prices, product mix, waste, a stock-count error or a different sales denominator. Compare the usage account with theoretical recipe consumption before deciding what caused the movement. Avoid treating one benchmark as a target for every restaurant format.
An automated report should show the underlying movements and flag missing counts or unconfirmed transfers. It should also refuse to display an ordinary percentage when sales are zero or the period is incomplete. Start by reconciling one outlet and one completed week; then expand the integration once the team can reproduce the result from source records.
Summary
Food cost percentage is meaningful when its stock boundary, valuation and sales denominator are consistent. The calculation summarises usage; it does not diagnose the cause of a change. A reconciled usage account and recipe comparison give the manager the evidence needed for the next decision.
What to do next
- Reproduce one completed week's percentage from source counts and movements.
- Agree the handling of transfers, non-sale uses and the sales denominator with finance.
- Investigate the largest unexplained change before setting an improvement target.
Recognise this problem in your operation?
Tell us where the records or handovers break down. We can discuss the process, data and software questions worth examining first.
Sources and further reading
Sources checked 15 October 2026. The worked examples and software evaluation suggestions are NextEdge Labs’ editorial analysis.
- Monthly Food CostsBCcampus Open Education · Basic Kitchen and Food Service Management, online chapter 14
Educational reference for food cost from opening inventory, purchases and closing inventory. Site examples use original figures and explicit operating boundaries.
Visual credits
AI-generated illustration created for NextEdge Labs; it does not depict a client facility. Workflow diagram by NextEdge Labs. Icons from Lucide (ISC licence).