Inventory turns can improve while the cold room gets worse
For Inventory managers and supply-chain heads · Understand the problem
TL;DR — what you’ll learn
- Divide period cost of goods sold by average inventory valued on a compatible cost basis.
- Convert turns into inventory days using the same period length.
- Separate changes caused by product mix, prices and stock availability.
- Use lot-level expiry and service measures alongside the financial ratio.
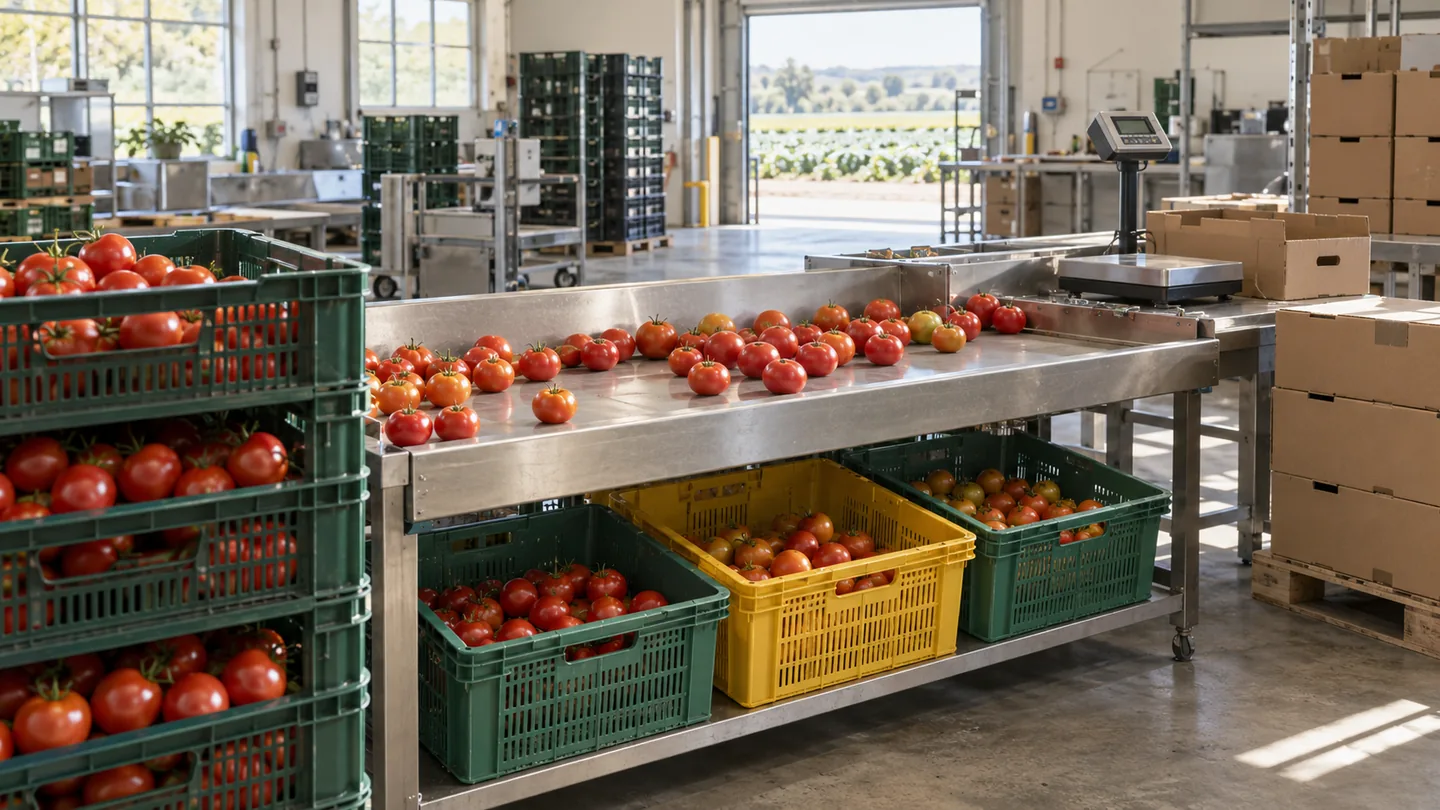
The monthly dashboard reports faster inventory turnover. At the same time, one dairy line keeps running out and a promotional beverage sits untouched in storage. The aggregate ratio may be correct. It is simply too broad to tell the operations team which stock problem to solve.
How do you calculate inventory turnover and interpret it in a food business?
Inventory turnover is cost of goods sold divided by average inventory for a defined period. Inventory days are the period's days divided by its turnover. The ratio describes aggregate movement of cost through inventory; it does not reveal whether individual food lots will sell before their usable window closes.
- 01Define the periodCost and stock scope
- 02Assemble the inputsCOGS and average inventory
- 03Check comparabilityValuation, cut-off and mixDo numerator and denominator match?YesInterpret the resultNoReconcile the scope before comparing periods or businesses.
- 04Interpret the resultTurns and inventory days
Illustrative information flow. The article explains the evidence, exceptions and responsible decisions. Diagram: NextEdge Labs.
Keep numerator and denominator on the same basis
Use cost of goods sold for the period and average inventory on a compatible cost basis. Dividing sales revenue by inventory at cost mixes two valuation bases and makes the result sensitive to selling margin. BDC's inventory-turnover explanation uses cost of goods sold divided by average inventory and converts the ratio to days using the period length.
The simplest average uses opening and closing inventory. More frequent observations can represent a fluctuating operation better, provided the valuation and scope remain consistent. State which average was used. A business receiving a large shipment just after month-end can look very different under an endpoint average and a daily average.
Source: Business Development Bank of Canada (BDC) · Turnover and inventory-days formulas. Reference details
Calculate one period without accidentally annualising it
For an illustrative thirty-day month, cost of goods sold is ₹24 lakh and average inventory is ₹6 lakh. Turnover for that month is 24 ÷ 6 = four times. Inventory days are 30 ÷ 4 = 7.5 days. Calling four the annual turnover would misstate the period. Dividing 365 by four would also mix an annual day count with a monthly turnover figure.
The 7.5-day result is an aggregate financial measure. It does not mean every item has 7.5 days of usable supply. A chilled ingredient and a long-life packaging item can sit within the same inventory value while having entirely different replenishment and expiry constraints.
| Measure | Calculation | Result |
|---|---|---|
| Period turnover | ₹24 lakh ÷ ₹6 lakh | 4 turns during the month |
| Inventory days | 30 days ÷ 4 | 7.5 days |
| Scope | Same business unit and cost basis | Required for a meaningful comparison |
A higher turnover number is not always a better outcome
Inventory can fall because purchasing and planning improved. It can also fall because the business repeatedly runs out of stock. In both cases the ratio may rise. Compare the result with unfilled demand, emergency purchases and service performance before describing the change as an improvement.
A product-mix shift can change the ratio without any change in stock discipline. If a fast-selling product takes a larger share of cost of goods sold, overall turns may improve while a smaller slow-moving line accumulates old lots. Review major product families and material stages separately where the underlying accounting allows a consistent comparison.
Connect the ratio to an operational investigation
Use the financial measure to locate a question, then move to the records that explain it. High inventory days in finished goods may point to mismatched production or demand. A rise in work in progress may involve queues, incomplete reporting or release delays. Raw-material inventory may reflect purchase minimums or changed lead times. None of those causes can be established from the ratio alone.
For perishables, add a lot-level view of free quantity, eligible demand and the latest useful dispatch or consumption date. Keep packaging separate where it would distort the picture. A month-end balance can look lean while a small quantity of high-value short-life stock still creates a significant write-off exposure.
Choose a target from the operating model
There is no single inventory-turn target that fits a central kitchen, a seasonal processor and a food distributor equally. Compare the business with its own service commitments, production cycle, usable life and supply constraints. External benchmarks need matching definitions before they are useful.
An automated dashboard should display the period, valuation scope, averaging method and refresh time beside the number. Let a user trace the result to its source totals and investigate changes by category. That transparency is more useful than an unexplained red or green threshold. Finance and operations should agree what action a change will trigger before the report becomes a standing performance measure.
Summary
Inventory turnover and inventory days are useful financial summaries when calculated consistently. They need operational context to guide food-stock decisions. Pair them with availability, expiry exposure and stage-specific balances so an apparent improvement does not hide a shortage or an ageing lot.
What to do next
- Confirm the period, cost basis, inventory scope and averaging method used in the current report.
- Recalculate one month and compare it with shortage and expiry records.
- Investigate the product family or stock stage responsible for the largest unexplained change.
Recognise this problem in your operation?
Tell us where the records or handovers break down. We can discuss the process, data and software questions worth examining first.
Sources and further reading
Sources checked 15 October 2026. The worked examples and software evaluation suggestions are NextEdge Labs’ editorial analysis.
- Inventory turnoverBusiness Development Bank of Canada (BDC) · Business glossary, accessed October 2026
Reference for cost-of-goods-sold-based turnover and inventory days. Food-specific examples and interpretation are original editorial analysis, not industry benchmarks.
Visual credits
AI-generated illustration created for NextEdge Labs; it does not depict a client facility. Workflow diagram by NextEdge Labs. Icons from Lucide (ISC licence).